M1.5. Plotting
MATLAB has many nice graphics capabilities. Here, we will illustrate standard two-dimensional plots. First, generate two vectors for plotting
» x = 1:2:11;
» z = 5:5:30;
For a standard solid line plot, simply enter
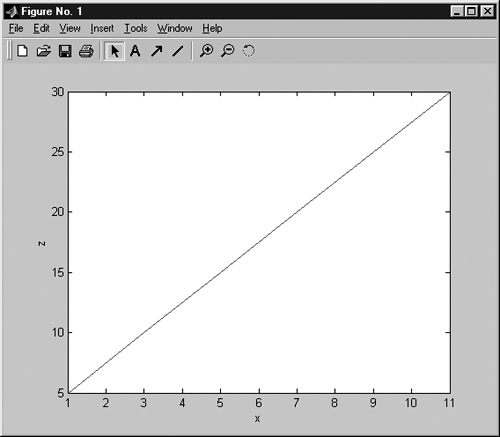
» plot(x,z)
and Figure M1-2 appears. Axis labels are added by selecting “Insert” and specifying X label or Y label. Alternatively, in the command window you can use the following commands (perform this):
» xlabel('x')
» ylabel('z')
Figure M1-2. Example plot.

For more plotting options, type
» help plot
If we wish to plot discrete points, using + as a symbol, we can use the following (perform this):
» plot(x,z,'+') ...
Get Process Control: Modeling, Design, and Simulation now with the O’Reilly learning platform.
O’Reilly members experience books, live events, courses curated by job role, and more from O’Reilly and nearly 200 top publishers.

