Solved Problem 2
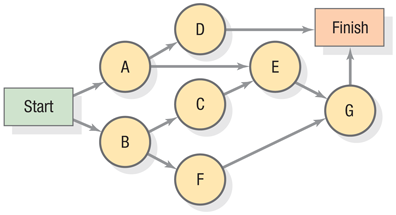
An advertising project manager developed the network diagram shown in Figure 7.10 for a new advertising campaign. In addition, the manager gathered the time information for each activity, as shown in the accompanying table.

Figure 7.10 Network Diagram for the Advertising Project
TIME ESTIMATES (WKS)
Activity
Optimistic
Most Likely
Pessimistic
Immediate Predecessor(s)
A
1
4
7
—
B
2
6
7
—
C
3
3
6
B
D
6
13
14
A
E
3
6
12
A, C
F
6
8
16
B
G
1
5
6
E, F
Calculate the expected time and variance for each activity.
Calculate the activity slacks and determine the critical ...
Get Operations Management: Processes and Supply Chains, 12th Edition now with the O’Reilly learning platform.
O’Reilly members experience books, live events, courses curated by job role, and more from O’Reilly and nearly 200 top publishers.

