136 II Rendering
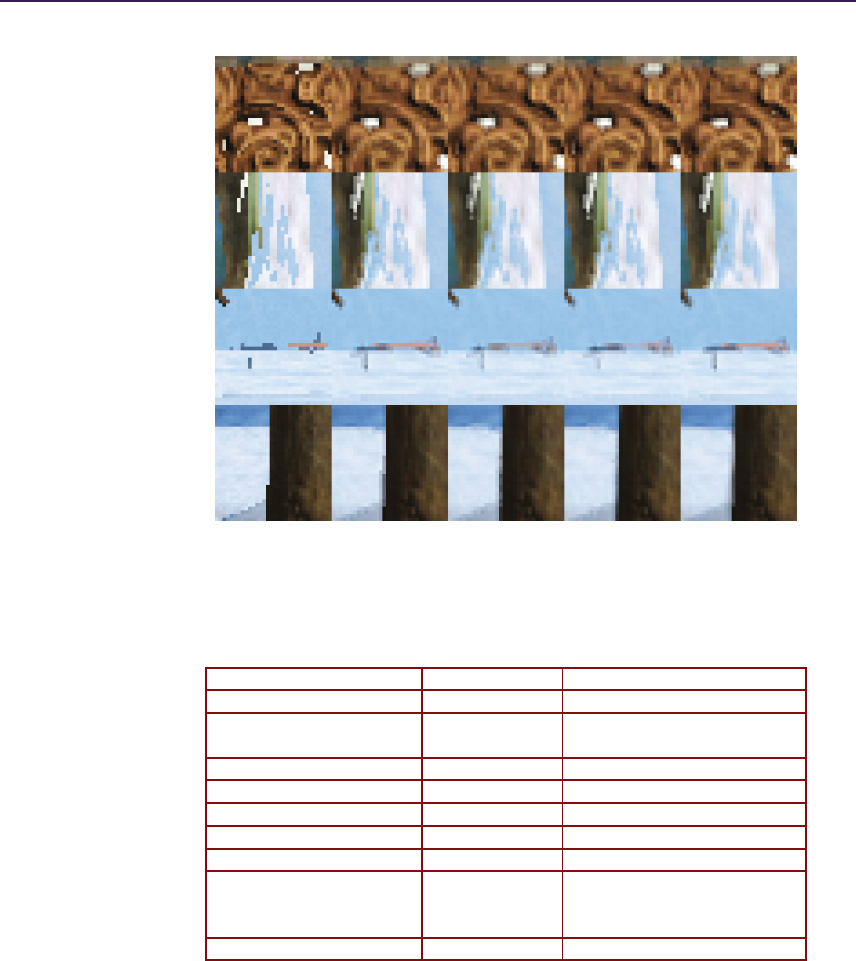
Figure 3.25. Comparison of different HRAA setups showing different scenarios based on
actual game content. From left to right: centroid sampling (no antialiasing), temporal
FLIPQUAD (TFQ), AEAA + TFQ, CRAA + TFQ, and SMAA + TFQ.
Single Pass Timing (ms) G-Buffer Overhead (%)
BFECC single value 0.3 N/A
Temporal FLIPQUAD
(TFQ)
0.2 N/A
AEAA 0.25 < 1% C
8×CRAA 0.25 < 8% HW/C
SMAA 0.9 N/A
TAA 0.6 N/A
TFQ + TAA 0.62 N/A
AEAA(alpha test) +
8×CRAA + TFQ +
TAA
0.9 < 3% HW/C
SMAA+TFQ+TAA 1.4 N/A
Table 3. 2. Different HRAA passes and timings measured on an AMD Radeon HD 7950
at 1080p resolution, operating on 32-bit image buffers. “C” means content dependent
and ...