2.10 Adding Text or Figures to a Graph
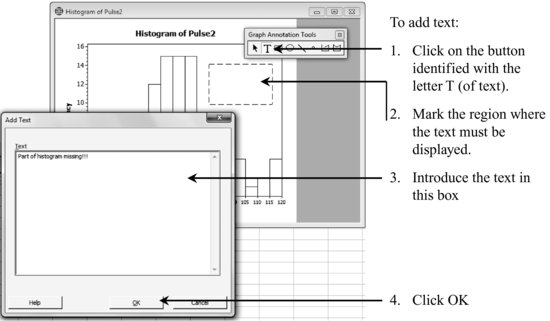
Choose as an active window the graph to be modified. Using:
Editor > Anotation > Graph Annotation Tools
a bar appears allowing the addition of text and figures to a graph.

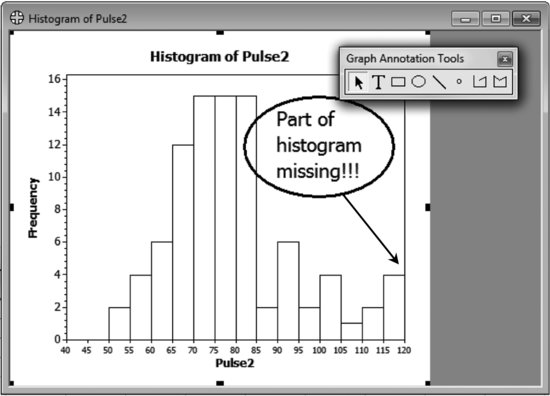
The ellipse and the line (that once edited becomes an arrow) are drawn by clicking over the corresponding icons shown in the menu. All introduced elements can be edited (by double-clicking) and modified (increasing the font size of the text, changing the type of line from a continuous to a discontinuous line …) as needed.

Get Industrial Statistics with Minitab now with the O’Reilly learning platform.
O’Reilly members experience books, live events, courses curated by job role, and more from O’Reilly and nearly 200 top publishers.

