October 2012
Beginner
420 pages
9h 37m
English
22.4 Simple Regression with ‘Regression’
Consider once again the data in file PULSE.MTW and do the following.
Stat > Regression > Regression

Use all default options to obtain the following (blank spaces have been added to improve the appearance of the output and facilitate its interpretation).


22.4.1 Data Points Identified as ‘Unusual Observations’
The data points identified with an R are those that fall more than two standard deviations away from the line. Values between two and three are normal (it is expected to have five per every 100 points). Values greater than three are scarce: it is highly recommended to identify the corresponding observations to apply a special treatment to them if considered necessary.
The data points identified with an X may have a small standardized residual, but fall away from the cloud of points and thus have a large influence on the line; thus, it becomes necessary to assess the convenience of maintaining them in the study.
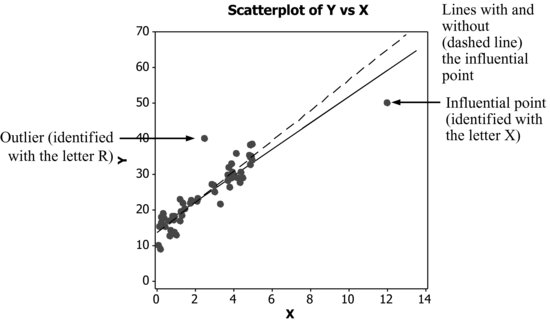
The data used to construct the previous plot are contained in the file POINTS_RX.MTW.
Read now
Unlock full access


