October 2012
Beginner
420 pages
9h 37m
English
19.5 Some Ideas on How to Use Minitab as a Simulator of Processes for Didactic Reasons
Using the possibility of automatically updating the graphs and the use of macros or executable files, the evolution of a control chart can be simulated. The next file should be first created using: Tools > Notepad.

To indicate Minitab where to find the files to be executed later, do: Tools > Options:
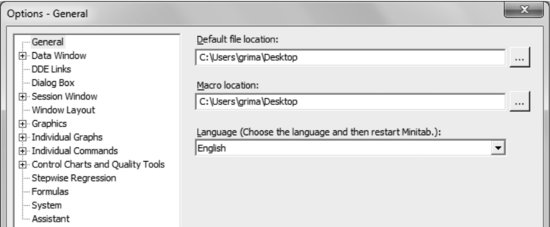
We have indicated that the files are located on the desktop (use the button with three dots to locate the situation in your computer).
Now, place four values from a Normal (0; 1) in column C2. This can be done via Calc > Random Data > Normal, but it can also be done simply by typing the following command in the session window (the option Enable Commands must first be activated):
MTB > random 4 c2
Create now the chart Xbar-R using: Stat > Control Charts > Variables Charts for Subgroups > Xbar-R
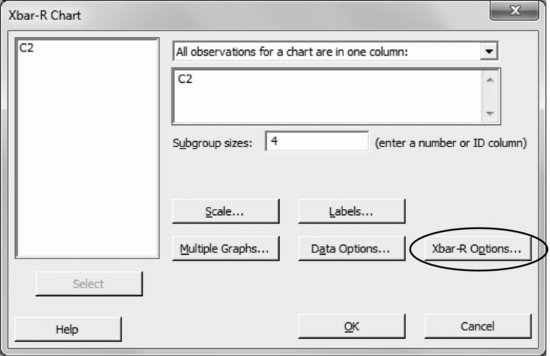
To avoid that limits changing as the points appear, use the option:
Xbar-R Options > Parameters: Mean ...
Read now
Unlock full access


