October 2012
Beginner
420 pages
9h 37m
English
21.3 Mattresses (2nd Part)
With these data and all default options, draw again a ![]() - R chart:
- R chart:
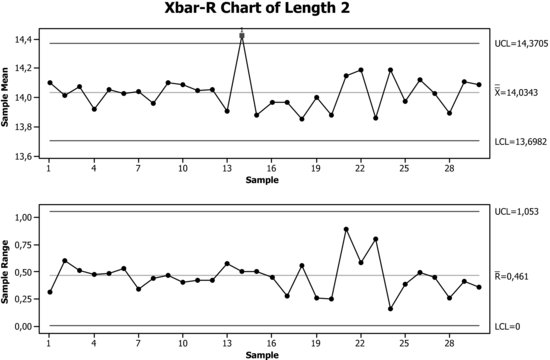
The process is, basically, in a state of control. Nonetheless, the point detected outside the control limits needs to be investigated in order to find the cause that produced that behaviour. For a more detailed study, use the Capability Sixpack tool.
Stat > Quality Tools > Capability Sixpack > Normal
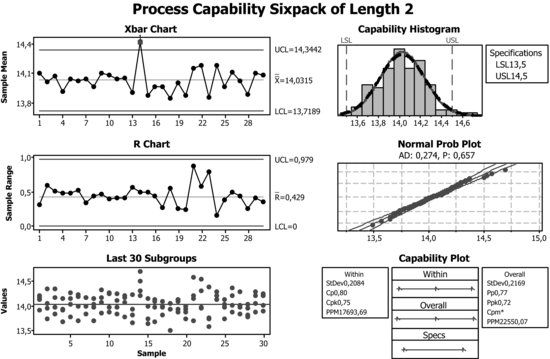
Clicking on Options, enter 30 in Number of subgroups display: Last so that the points of all samples are displayed in the graph named Last 30 subgroups, in such a way that they are aligned with their means and ranges.
The data follow a normal distribution reasonably well and the process is, basically, in state of control. ...
Read now
Unlock full access


