Skip to Content
Industrial Statistics with Minitab
book

Industrial Statistics with Minitab

by Pere Grima Cintas, Lluis Marco Almagro, Xavier Tort-Martorell Llabres
October 2012
Beginner
420 pages
9h 37m
English
Wiley
Content preview from Industrial Statistics with Minitab

13.8 Calibration and Linearity Study of the Measurement System

Retrieve the worksheet file: GAGELIN.MTW and do the following.

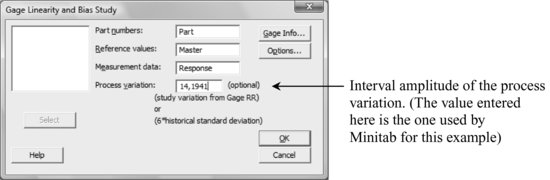
Stat > Quality Tools > Gage Study > Gage Linearity and Bias Study

nc13uf013.eps
nc13uf014.eps

Where Does the Output Information of the Linearity Study Come from and How to Interpret It?
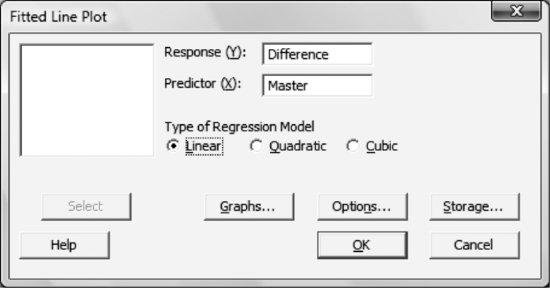
Graph: Shows the difference between the measured value and the real one (Bias), versus the real value (Reference). It may also be drawn by placing the difference between C3 (Response) and C2 (Master) in column C4 (named Difference) and then choosing:
Stat > Regression > Fitted Line Plot
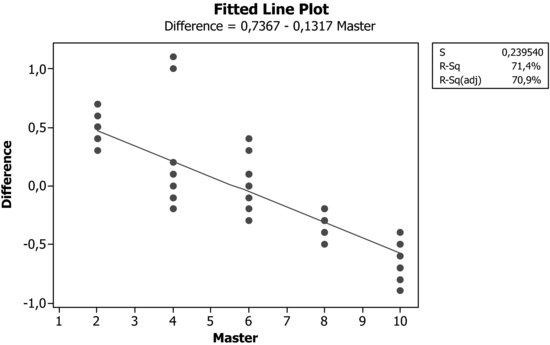
nc13uf015.eps
nc13uf016.eps
Linearity: Product of the slope of the regression line times the amplitude of the process variation. Thus, in our case:
Linearity = 0.13167×14.1941 = 1.8689.
%Linearity Slope of the regression line multiplied by 100. Here, the variation due to linearity is equivalent to 13% of the total variation.
Bias: In the first line, the average of all differences between the measured and reference values is shown (corresponding in this case to the mean of column C4). Just beneath, the corresponding deviations ...
Become an O’Reilly member and get unlimited access to this title plus top books and audiobooks from O’Reilly and nearly 200 top publishers, thousands of courses curated by job role, 150+ live events each month,
and much more.

Read now

Unlock full access

More than 5,000 organizations count on O’Reilly

AirBnbBlueOriginElectronic ArtsHomeDepotNasdaqRakutenTata Consultancy Services

QuotationMarkO’Reilly covers everything we've got, with content to help us build a world-class technology community, upgrade the capabilities and competencies of our teams, and improve overall team performance as well as their engagement.
Julian F.
Head of Cybersecurity
QuotationMarkI wanted to learn C and C++, but it didn't click for me until I picked up an O'Reilly book. When I went on the O’Reilly platform, I was astonished to find all the books there, plus live events and sandboxes so you could play around with the technology.
Addison B.
Field Engineer
QuotationMarkI’ve been on the O’Reilly platform for more than eight years. I use a couple of learning platforms, but I'm on O'Reilly more than anybody else. When you're there, you start learning. I'm never disappointed.
Amir M.
Data Platform Tech Lead
QuotationMarkI'm always learning. So when I got on to O'Reilly, I was like a kid in a candy store. There are playlists. There are answers. There's on-demand training. It's worth its weight in gold, in terms of what it allows me to do.
Mark W.
Embedded Software Engineer

You might also like

Statistics for Six Sigma Green Belts with Minitab and JMP

Statistics for Six Sigma Green Belts with Minitab and JMP

David M. Levine
Reliability Prediction and Testing Textbook

Reliability Prediction and Testing Textbook

Lev M. Klyatis, Edward L. Anderson
Minitab Cookbook

Minitab Cookbook

Isaac A Newton

Publisher Resources

ISBN: 9781118383780Purchase book