October 2012
Beginner
420 pages
9h 37m
English
15.4 Capability Study for Variables that Follow a Poisson Distribution
Here, use the file OVEN_PAINTED.MTW since the number of defects per unit is a typical example of a variable that follows a Poisson distribution.
Stat > Quality Tools > Capability Analysis (Poisson)

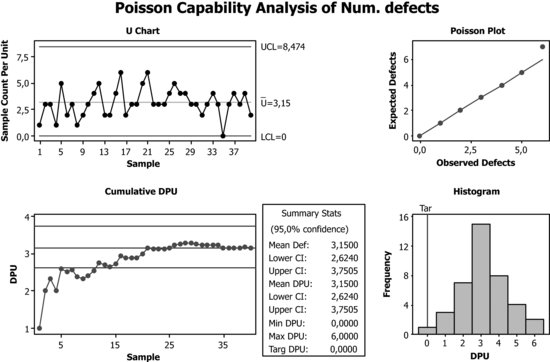
The process remains stable at about 3 defects per unit. The graph of the cumulative average value indicates that the number of samples is sufficient. Additionally, the Poisson Plot suggests that the hypothesis that the data follows a Poisson distribution is perfectly reasonable.
Read now
Unlock full access


