October 2012
Beginner
420 pages
9h 37m
English
18.3 Customizing the Graph
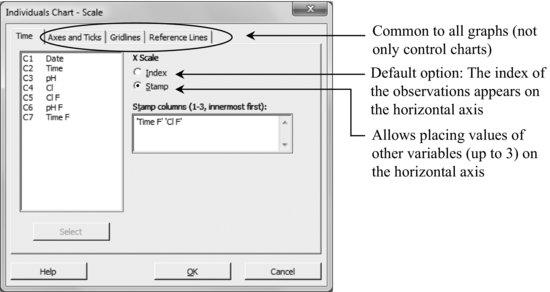
Scale

Labels
This allows the addition of titles and comments at the bottom.
Multiple Graphs
If multiple graphs are drawn, the vertical scale can be forced to be same for all.
Data Options
This allows the selection of the values to be represented. For example, with option Brush (Editor > Brush, with the graph window being active) we can see that the point outside the control limits is the one in row 25. If you want to exclude it, do the following:

Read now
Unlock full access


