October 2012
Beginner
420 pages
9h 37m
English
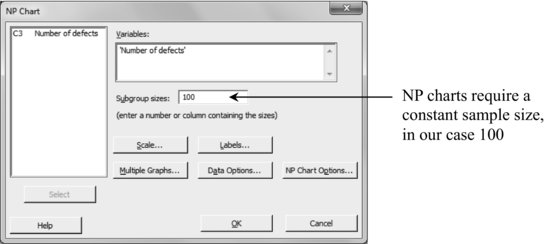
20.4 Plotting the Number of Defective Units (NP)
Using data in file CATHETER.MTW, proceed to construct a NP chart as follows.
Stat > Control Charts > Attributes Charts > NP
Using the default options one obtains:

One point lies above the upper control limit. A special cause was found for this unusual increase in the number of defective catheters (a defective lot of raw material), making it reasonable to recalculate the control limits after removing such a singular point.

After the recalculation, as expected, the upper control limit is now slightly smaller.
Read now
Unlock full access


