October 2012
Beginner
420 pages
9h 37m
English
23.2 Exploratory Analysis
To start, the best strategy consists in taking a look at the data and a good way to do this is through: Graph > Matrix Plot: Simple

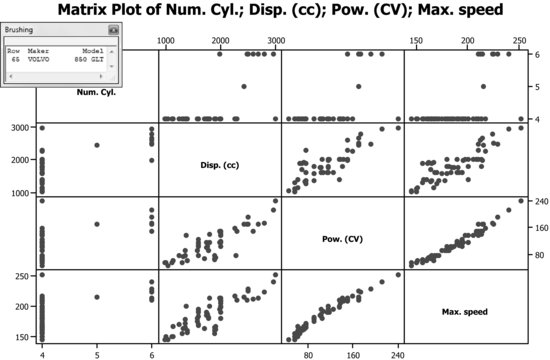
In the previous plot, observe that there is only one car with five cylinders. Use the option Brush (see Chapter 4) to identify that this point belongs to a Volvo 850 GLT.
Also, it seems that the relationship between power and maximum speed is not linear but quadratic. We will try to confirm this impression by analyzing the corresponding residuals.
Read now
Unlock full access


