4.4 Using the ‘Crosshairs’ Option
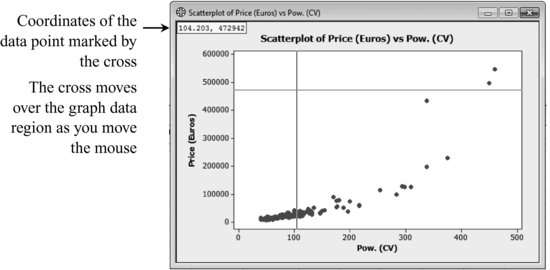
Use the Crosshairs option to get the X–Y coordinates of any data point on the graph. To activate it, go to: Editor > Crosshairs or click the icon fx in the Graph Editing toolbar. Notice that the cursor becomes a cross that can be moved over the graph and that the coordinates are shown in the upper left corner of the graph.

Get Industrial Statistics with Minitab now with the O’Reilly learning platform.
O’Reilly members experience books, live events, courses curated by job role, and more from O’Reilly and nearly 200 top publishers.

