October 2012
Beginner
420 pages
9h 37m
English
20.5 Plotting the Number of Defects per Constant Unit of Measurement (C)
The number of daily visits can be assumed to follow a Poisson distribution, and as the unit of measurement is constant (one day), a C chart can be used to represent its evolution.
Stat > Control Charts > Attributes Charts > C


The marked peak observed around day 10 is due to a newspaper advertisement of this website, clearly implying the presence of a special cause. Additionally, the so-called valleys, many of which also lie outside the limits, correspond to weekends when a remarkably smaller number of visits are produced in contrast to working days.
Using the Data options button, we remove the data corresponding to Saturdays and Sundays from the chart:
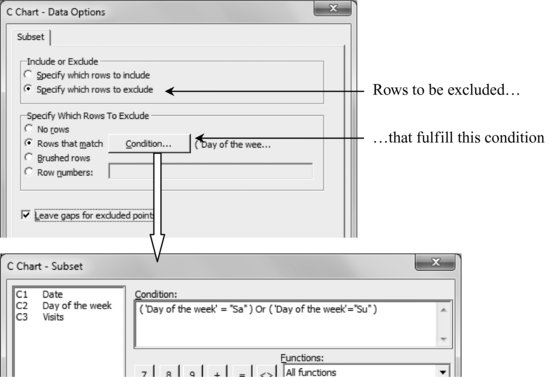
Then, the following chart is obtained, where the limits were recomputed based only on the remaining points. ...
Read now
Unlock full access


