22.1 Correlation Coefficient
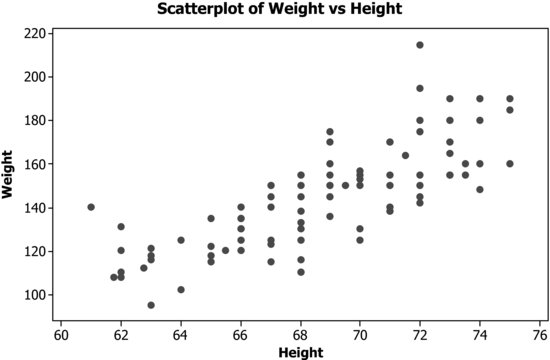
Before starting to calculate the correlation coefficient, it is highly recommended to construct a scatterplot of the data to identify possible outliers, nonlinear relationships (correlation coefficient only measures linear relationships), etc.
Graph > Scatterplot: Simple

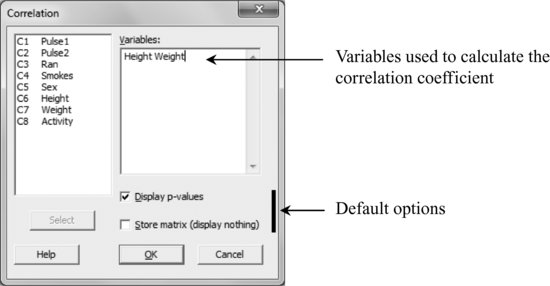
To calculate the correlation coefficient, do the following.
Stat > Basic Statistics > Correlation

In this way, the output in the session window looks as follows:

You can also select more than two variables, in which case pairwise correlation coefficients are calculated. ...
Get Industrial Statistics with Minitab now with the O’Reilly learning platform.
O’Reilly members experience books, live events, courses curated by job role, and more from O’Reilly and nearly 200 top publishers.

