October 2012
Beginner
420 pages
9h 37m
English
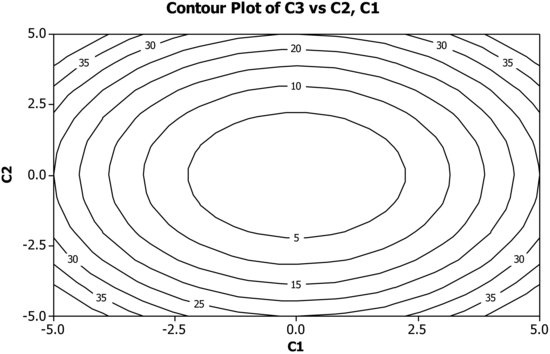
5.3 Contour Plots
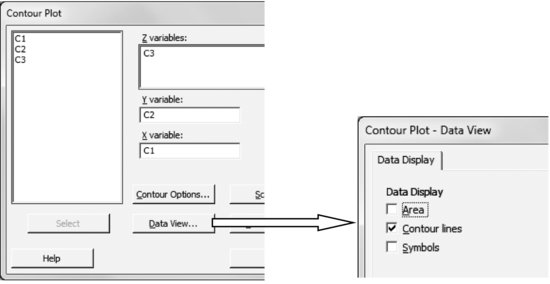
Graph > Contour Plot
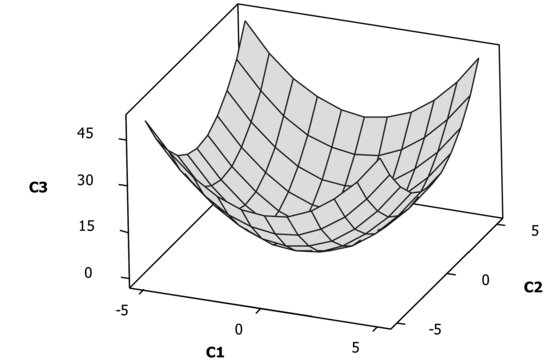
Generate data points with Calc > Make Mesh Data:

Graphing a mesh surface as follows.
Graph > 3D Surface Plot: Wireframe
Graph > Contour Plot

5.3.1 Contour Plot Options
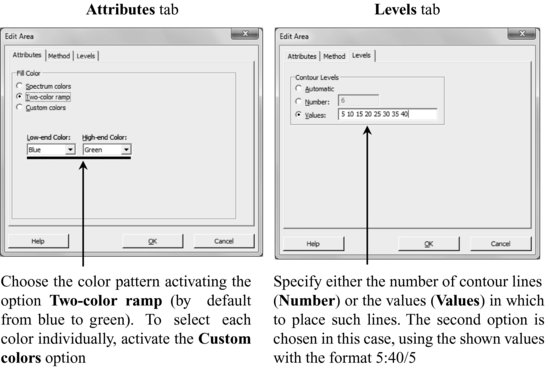
Double-clicking over the contour plot, a dialog box pops up with options to change the filling color pattern and the number of levels.

You can draw the contour lines without colors and indicating the value corresponding to each one of them. To do so, use the Data View options:
In Contour Options, you can indicate the values on which you want the contour lines.
Read now
Unlock full access


