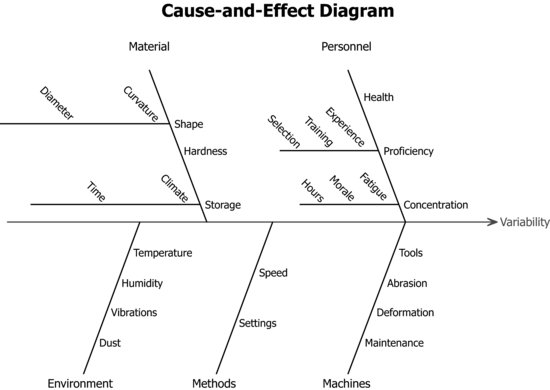
3.3 Cause-and-Effect Diagrams
Stat > Quality tools > Cause-and-Effect
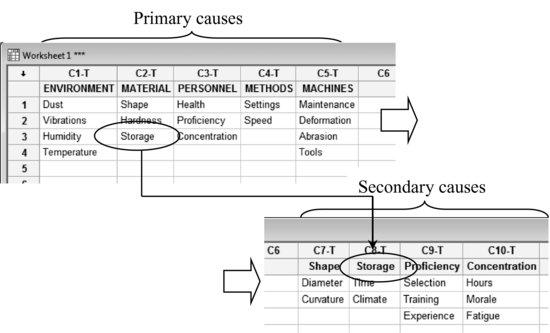
First, the potential causes must be entered in the worksheet. For example:

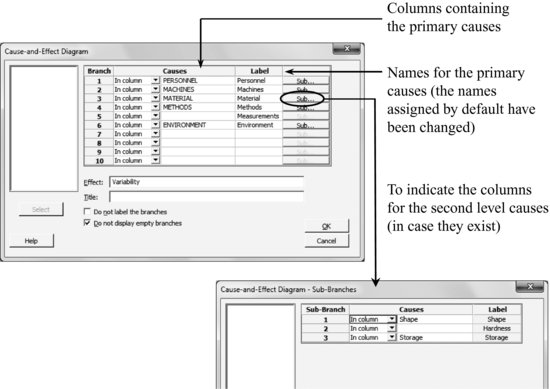
Once all potential causes are introduced in the worksheet, go to: Stat > Quality Tools > Cause and Effect…


Get Industrial Statistics with Minitab now with the O’Reilly learning platform.
O’Reilly members experience books, live events, courses curated by job role, and more from O’Reilly and nearly 200 top publishers.

