October 2012
Beginner
420 pages
9h 37m
English
5.2 3D Surface Plots
Graph > 3D Surface Plot
Used to represent functions of the type z = f (x, y). To introduce the mesh of values (x, y), it is very useful to use the option: Calc> Make Mesh Data
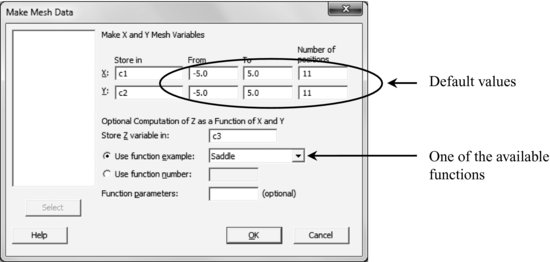
In addition to the built-in functions, you can also add others, the results of which are a bit cumbersome because they require modifying an already built Minitab macro.

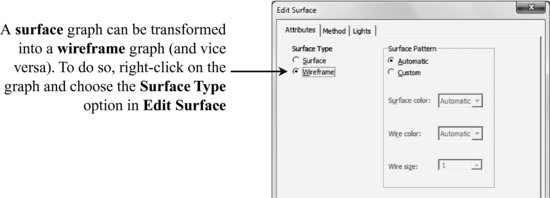
The dialog box that appears is exactly the same whether you choose the Surface or the Wireframe option.


The axes of both types of 3D scatterplots, Surface and Wireframe graphs, can be rotated interactively. To do so, use the 3D Graph Tools toolbar. Additionally, Surface graphs can be illuminated by rotating the light source.

You can customize any feature of a 3D scatterplot, constructed using the options Surface or Wireframe: the mesh or surface colors, spotlights position, the mesh density, etc. To do so, double-click ...
Read now
Unlock full access


