October 2012
Beginner
420 pages
9h 37m
English
20.2 Plotting the Proportion of Defective Units (P)
Using the data in file MOTORS.MTW, proceed to construct a P chart as follows.
Stat > Control Charts > Attributes Charts > P

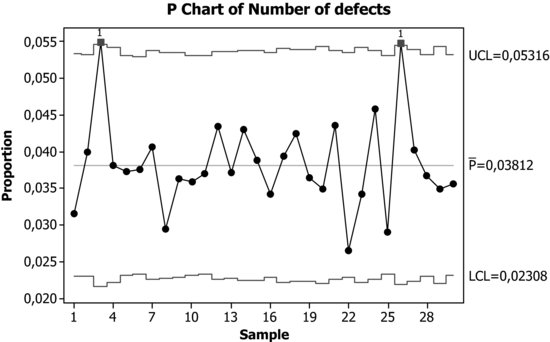
The control limits depend on the sample sizes. When the sample sizes vary, the limits also vary.
Since the number of daily motors produced is very similar, we can choose a constant subgroup size in subgroup sizes. In this case 1350 (approximately the average daily production) and consequently a chart with constant control limits would be obtained.
Read now
Unlock full access


