Graphics
As a last topic: you can put graphics or text information into a data frame directly from a variety of sources. This subject really gets us away from our intended goal—preparing you to do analyses with GIS—but it is a major feature of the software that you should know about, so we will look at it briefly.
Placing ancillary information on a data frame is done primarily with two sets of controls. The first is Insert on the Main menu. The second is the Drawing toolbar.20
____ 55. In ArcMap start a new map with Letter (ANSI A) Portrait. In Data View, add the shapefile
[___]IGIS-Arc\River\Boat_SP83.shp
to a new map.
____ 56. Also add the following data sets, in this order:
[___]IGIS-Arc\River\wtp_spn (the point component, water treatment plants)
[___]IGIS-Arc\River\cole_drg.tif
[___]IGIS-Arc\River\cole_doq64.jpg
[___]IGIS-Arc\Kentucky_wide_data\KY_Streams_spf.shp
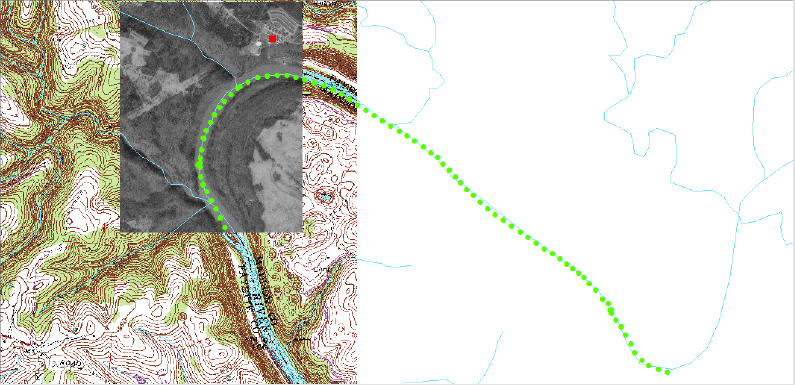
Make the point symbol for wpt_spn a bright red square of size 10. Make the Boat_SP83 symbols bright green circles of size 8. Pan and zoom the image until all of the DOQ and the GPS track are in. Your data frame should look something like Figure 3-19. Save this as
___IGIS-Arc_YourInitials\Map_Making\LWP1.mxd.
____ 57. Turn your attention to the Drawing toolbar. Run your cursor from left to right over each of the buttons while reading the ToolTips and/or the Status bar. On those buttons with ...

Get Introducing Geographic Information Systems with ArcGIS: A Workbook Approach to Learning GIS, 3rd Edition now with the O’Reilly learning platform.

O’Reilly members experience books, live events, courses curated by job role, and more from O’Reilly and nearly 200 top publishers.