Developing a Raster with Cost Distance
The following steps will illustrate the principle of calculating cost that is based on both distance and a cost surface. First, a quick review question:
____ 16. What would be the cost of the path going horizontally through a cell (cell size 10, cell cost 0.85)? Answer: 8.5. How about the cost of moving through that same cell, going diagonally? ________.
____ 17. Turn off all visible entries except Square_Grid. In the steps that follow, keep Square_Grid at the top of the T/C to delineate the cells of the displayed rasters.
The Tolls dataset is an artificial cost surface raster dataset. The surface is divided into rows of cells; all the cells in a given row have the same value.
____ 18. Add the cost surface raster, Tolls,8 from
___IGIS-Arc_YourInitials\Spatial_Analyst_Data\Proximity_Data_SA\Prox_Exp.gdb
In Layer Properties, under the Symbology tab, click Stretched under Show. Right-click the color ramp and turn off Graphic View. Make the color ramp of Tolls “Purple Bright”. Press the Labeling button. Type in ”9” for Number of Intervals and press Generate. Press OK. Press OK in Layer Properties. Look at the T/C for the values of the rows. See Figure 8-49 for the image.
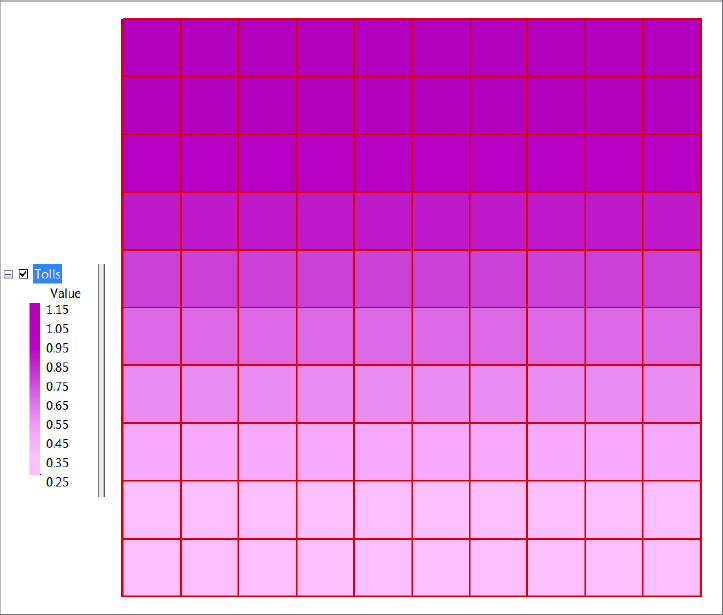
Imagine that the center of each cell contains a toll booth. Depending on which row the cell is in, the toll booth charge varies from 25 cents to $1.15 ...
Get Introducing Geographic Information Systems with ArcGIS: A Workbook Approach to Learning GIS, 3rd Edition now with the O’Reilly learning platform.
O’Reilly members experience books, live events, courses curated by job role, and more from O’Reilly and nearly 200 top publishers.

