The Cost Distance Calculation
If you want to generate a raster similar to that made by Euclidean distance, but one that will place in each cell the least cost of traveling from that cell to the source cell, you can use the cost distance calculation. Cost distance operates with inputs of a source raster and a cost-raster to produce a cost-distance raster. See Figure 8-15.
FIGURE 8-15 Making a cost distance raster
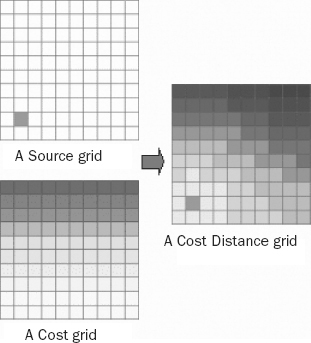
The source raster you already know about. The cost raster has darker colors for the cells that it is more expensive to traverse. The cost distance raster that is formed shows the cost to travel between a given cell and the source cell. Here the darker color indicates a greater cost in traveling between the source cell (dark) and every other cell.7 Notice particularly the northwest and southeast corners of the resulting raster. Even though they are the same distance from the source cell, it is clear that it is more expensive to travel from the northwest than from the southeast. The reason is that southern cells are cheaper to cross than northern ones.
When you apply the Cost Distance tool, the resulting raster shows up in ArcMap (asuming it is running) as a raster that you provide a name for.
Get Introducing Geographic Information Systems with ArcGIS: A Workbook Approach to Learning GIS, 3rd Edition now with the O’Reilly learning platform.
O’Reilly members experience books, live events, courses curated by job role, and more from O’Reilly and nearly 200 top publishers.

