May 1999
Intermediate to advanced
1440 pages
38h 6m
English
In this project, you'll walk through building an attractively formatted table that can automatically calculate results for each of your company's regions and quarters—and can be reused with virtually no effort.
Step #1: Build the skeleton of the table.
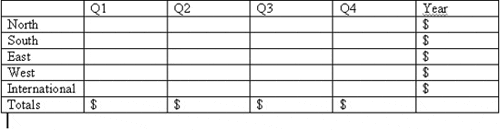
In our example, that means inserting a table 6 columns wide and 6 rows high, and then inserting the appropriate row and column headings (see Figure 9.44).
Step #2: Format the table.
In our example, we started by using Table AutoFormat's List 2 format, but we cleared AutoFit, because we wanted to keep control over the widths of each ...
Read now
Unlock full access


 O’Reilly covers everything we've got, with content to help us build a world-class technology community, upgrade the capabilities and competencies of our teams, and improve overall team performance as well as their engagement.I wanted to learn C and C++, but it didn't click for me until I picked up an O'Reilly book. When I went on the O’Reilly platform, I was astonished to find all the books there, plus live events and sandboxes so you could play around with the technology.I’ve been on the O’Reilly platform for more than eight years. I use a couple of learning platforms, but I'm on O'Reilly more than anybody else. When you're there, you start learning. I'm never disappointed.I'm always learning. So when I got on to O'Reilly, I was like a kid in a candy store. There are playlists. There are answers. There's on-demand training. It's worth its weight in gold, in terms of what it allows me to do.