December 2018
Beginner to intermediate
684 pages
21h 9m
English
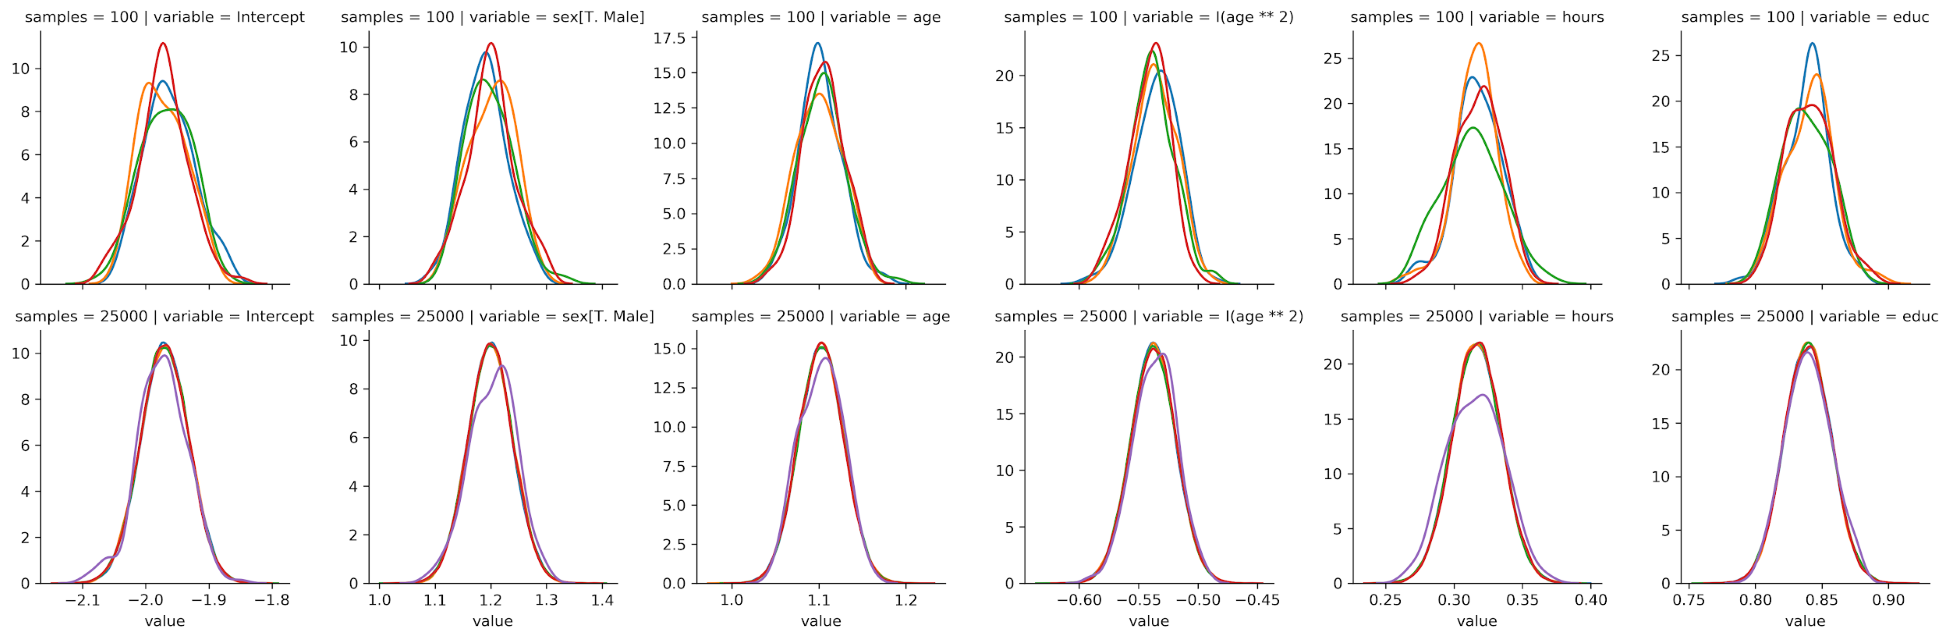
We can visualize the samples over time and their distributions to check the quality of the results. The following charts show the posterior distributions after an initial 100 and an additional 100,000 samples, respectively, and illustrate how convergence implies that multiple chains identify the same distribution. The pm.trace_plot() function shows the evolution of the samples as well (see the notebook for more information):
PyMC3 produces various summary statistics for a sampler. These are available as individual functions in the stats module, or by providing a trace to the pm.summary() function: