December 2018
Beginner to intermediate
684 pages
21h 9m
English
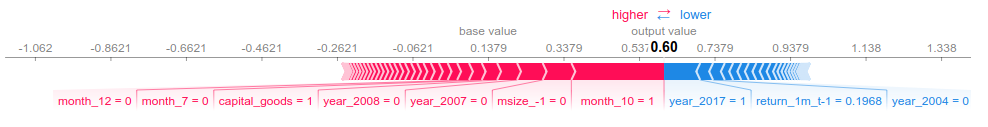
The following force plot shows the cumulative impact of various features and their values on the model output, which in this case was 0.6, quite a bit higher than the base value of 0.13 (the average model output over the provided dataset). Features highlighted in red increase the output. The month being October is the most important feature and increases the output from 0.338 to 0.537, whereas the year being 2017 reduces the output.
Hence, we obtain a detailed breakdown of how the model arrived at a specific prediction, as shown in the following image:
We can also compute force plots for numerous ...