Skip to Content
Pythonデータサイエンスハンドブック ―Jupyter、NumPy、pandas、Matplotlib、scikit-learnを使ったデータ分析、機械学習
book

Pythonデータサイエンスハンドブック ―Jupyter、NumPy、pandas、Matplotlib、scikit-learnを使ったデータ分析、機械学習

by Jake VanderPlas, 菊池 彰
May 2018
Intermediate to advanced
556 pages
13h 21m
Japanese
O'Reilly Japan, Inc.
Content preview from Pythonデータサイエンスハンドブック ―Jupyter、NumPy、pandas、Matplotlib、scikit-learnを使ったデータ分析、機械学習
226
4
章 
Matplotlib
による可視化
てプロット関数が定義されます。このスタイルを使用して先の図を再作成するには、次の手順を実
行します( 4-4)。
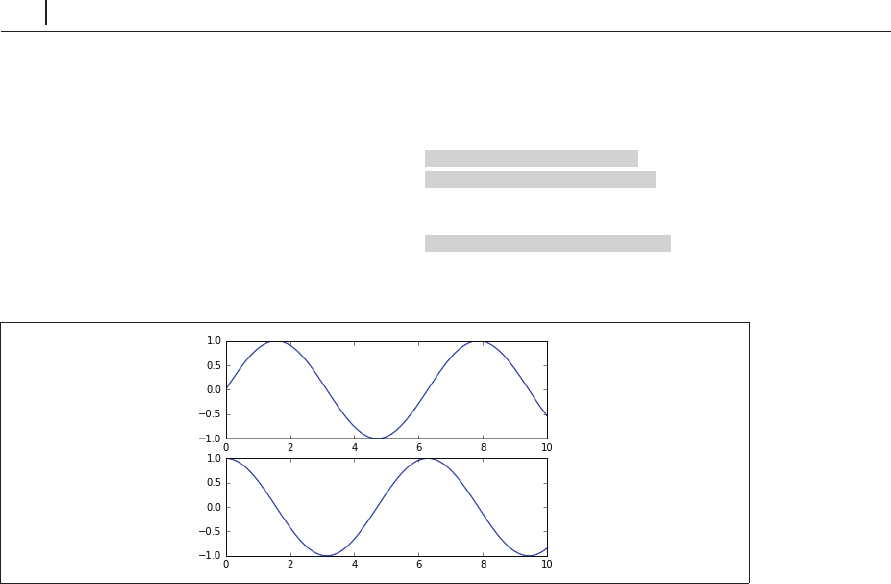
In[10]: # First create a grid of plots
最初にプロットのグリッドを作成する
# ax will be an array of two Axes objects ax
は、
2
つの座標軸オブジェクトの配列
fig, ax = plt.subplots(2)
# Call plot() method on the appropriate object
オブジェクトの
plot()
メソッドをコールする
ax[0].plot(x, np.sin(x))
ax[1].plot(x, np.cos(x));
図4-4 オブジェクト指向スタイルのインターフェースを用いた複数グラフ
より単純なプロットでは、使用するスタイルの選択は単に好みの問題ですが、プロットが複雑
になるにつれてオブジェクト指向のアプローチが必要になります。この章では、問題に応じて
MATLAB
スタイルとオブジェクト指向インターフェースの便利な方を使います。ほとんどの場合、
その違いは
plt.plot()
ax.plot()
に変更する程度の小さなものですが、次の節で説明するように
いくつかの問題点もあります。
4.3
 単純な線グラフ
y
f
(
x
)
の可視化が、おそらくあらゆるプロットの中で最も単純なものです。こうした簡単なプ
ロットを作成する方法を、まず見てみましょう。後続の節でも行うように、必要なパッケージのイ ...
Become an O’Reilly member and get unlimited access to this title plus top books and audiobooks from O’Reilly and nearly 200 top publishers, thousands of courses curated by job role, 150+ live events each month,
and much more.
Start your free trial

You might also like

Pythonデータサイエンスハンドブック 第2版 ―Jupyter、NumPy、pandas、Matplotlib、scikit-learnを使ったデータ分析、機械学習

Pythonデータサイエンスハンドブック 第2版 ―Jupyter、NumPy、pandas、Matplotlib、scikit-learnを使ったデータ分析、機械学習

Jake VanderPlas, 菊池 彰
初めてのGraphQL ―Webサービスを作って学ぶ新世代API

初めてのGraphQL ―Webサービスを作って学ぶ新世代API

Eve Porcello, Alex Banks, 尾崎 沙耶, あんどうやすし

Publisher Resources

ISBN: 9784873118413Other