5.7
詳細:サポートベクターマシン
409
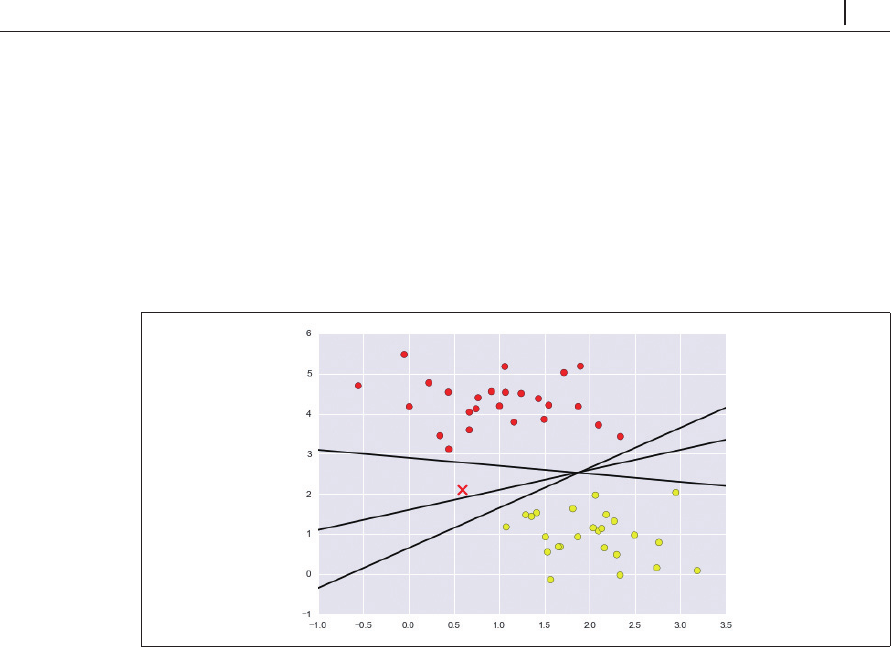
いくつか例を示しましょう(図 5-54)。
In[3]: xfit = np.linspace(-1, 3.5)
plt.scatter(X[:, 0], X[:, 1], c=y, s=50, cmap='autumn')
plt.plot([0.6], [2.1], 'x', color='red', markeredgewidth=2, markersize=10)
for m, b in [(1, 0.65), (0.5, 1.6), (-0.2, 2.9)]:
plt.plot(xfit, m * xfit + b, '-k')
plt.xlim(-1, 3.5);
図5-54 3つの線形識別分類
これらはデータを完全に分割する
3
つのまったく異なる分割線です。どの線を選択するかにより、
新しいデータポイント(図 5-54の「
X
」でマークされたポイント)に対して別のラベルが割り当てら
れます。「クラスの間に線を引く」という単純かつ直感的な考え方は十分ではなく、もう少し深い
考察が必要です。
5.7.2
サポートベクターマシン:マージンの最大化
サポートベクターマシンはこうした状況を改善する
1
つの方法を示します。直感的に理解するな
ら、単純にクラスの間に幅がゼロの線を描画するのではなく、ある幅のマージンを線の周囲に最も
近い点まで描画することを考えます。例で示しましょう(図 5-55)。
In[4]:
xfit = np.linspace(-1, 3.5) ...