Skip to Content
Pythonデータサイエンスハンドブック ―Jupyter、NumPy、pandas、Matplotlib、scikit-learnを使ったデータ分析、機械学習
book

Pythonデータサイエンスハンドブック ―Jupyter、NumPy、pandas、Matplotlib、scikit-learnを使ったデータ分析、機械学習

by Jake VanderPlas, 菊池 彰
May 2018
Intermediate to advanced
556 pages
13h 21m
Japanese
O'Reilly Japan, Inc.
Content preview from Pythonデータサイエンスハンドブック ―Jupyter、NumPy、pandas、Matplotlib、scikit-learnを使ったデータ分析、機械学習
288
4
章 
Matplotlib
による可視化
4.13.2
 デフォルトの変更:
rcParams
Matplotlib
がロードされるたびに実行時設定(
rc
runtime configuration
)が読み込まれ、すべて
のプロット要素のデフォルトスタイルが定義されます。この設定は、
plt.rc
関数を使用していつ
でも変更できます。デフォルトのプロットが手作業で調整したものと同じになるよう、
rc
パラメー
タを変更してみましょう。
現在のセッションで行う変更を簡単に元に戻せるように、最初に
rcParams
辞書のコピーを保存
します。
In[4]: IPython_default = plt.rcParams.copy()
次に
plt.rc
関数を使用して、設定の一部を変更します。
In[5]: from matplotlib import cycler
colors = cycler('color',
['#EE6666', '#3388BB', '#9988DD',
'#EECC55', '#88BB44', '#FFBBBB'])
plt.rc('axes', facecolor='#E6E6E6', edgecolor='none',
axisbelow=True, grid=True, prop_cycle=colors)
plt.rc('grid', color='w', linestyle='solid')
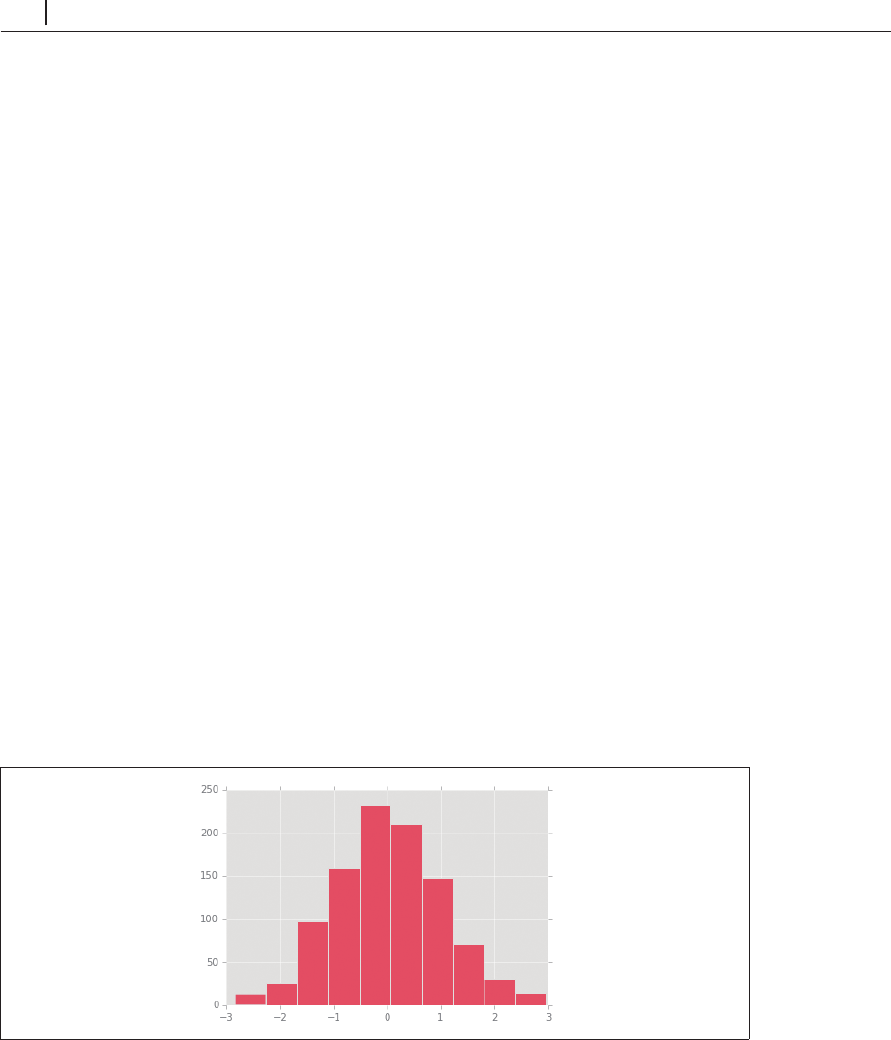
plt.rc('xtick', direction='out', color='gray') ...
Become an O’Reilly member and get unlimited access to this title plus top books and audiobooks from O’Reilly and nearly 200 top publishers, thousands of courses curated by job role, 150+ live events each month,
and much more.
Start your free trial

You might also like

Pythonデータサイエンスハンドブック 第2版 ―Jupyter、NumPy、pandas、Matplotlib、scikit-learnを使ったデータ分析、機械学習

Pythonデータサイエンスハンドブック 第2版 ―Jupyter、NumPy、pandas、Matplotlib、scikit-learnを使ったデータ分析、機械学習

Jake VanderPlas, 菊池 彰
初めてのGraphQL ―Webサービスを作って学ぶ新世代API

初めてのGraphQL ―Webサービスを作って学ぶ新世代API

Eve Porcello, Alex Banks, 尾崎 沙耶, あんどうやすし

Publisher Resources

ISBN: 9784873118413Other