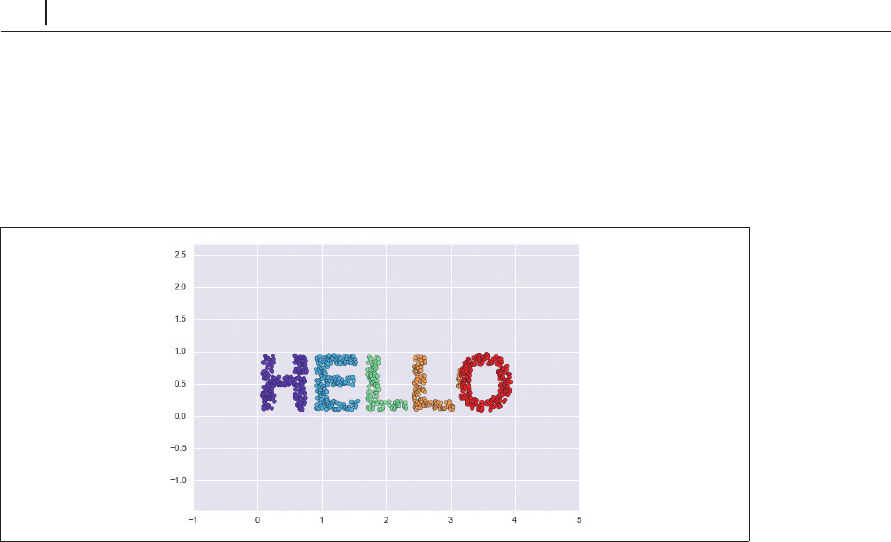
Skip to Content
Pythonデータサイエンスハンドブック ―Jupyter、NumPy、pandas、Matplotlib、scikit-learnを使ったデータ分析、機械学習
book

Pythonデータサイエンスハンドブック ―Jupyter、NumPy、pandas、Matplotlib、scikit-learnを使ったデータ分析、機械学習

by Jake VanderPlas, 菊池 彰
May 2018
Intermediate to advanced
556 pages
13h 21m
Japanese
O'Reilly Japan, Inc.
Content preview from Pythonデータサイエンスハンドブック ―Jupyter、NumPy、pandas、Matplotlib、scikit-learnを使ったデータ分析、機械学習
448
5
章 機械学習
この関数を呼び出し、結果を可視化します( 5-94)。
In[3]: X = make_hello(1000)
colorize = dict(c=X[:, 0], cmap=plt.cm.get_cmap('rainbow', 5))
plt.scatter(X[:, 0], X[:, 1], **colorize)
plt.axis('equal');
図5-94 多様体学習に使用するデータ
2
次元の出力は、「
HELLO
」の形をしています。このデータにより、それぞれのアルゴリズムの
働きが視覚的に把握しやすくなります。
5.10.2
 多次元尺度構成法
このようなデータを見ると、
x
値と
y
値はデータの最も基本的な記述方法ではないことがわかり
ます。データを拡大、縮小、回転を行っても、データは「
HELLO
」に見えます。例えば、回転行列
を使用してデータを回転すると
x
y
の値は変化しますが、データそのものは基本的に変わりませ
ん( 5-95)。
In[4]: def rotate(X, angle):
theta = np.deg2rad(angle)
R = [[np.cos(theta), np.sin(theta)],
[-np.sin(theta), np.cos(theta)]]
return np.dot(X, R)
X2 = rotate(X, 20) + 5
plt.scatter(X2[:, 0], X2[:, 1], **colorize)
plt.axis('equal'); ...
Become an O’Reilly member and get unlimited access to this title plus top books and audiobooks from O’Reilly and nearly 200 top publishers, thousands of courses curated by job role, 150+ live events each month,
and much more.
Start your free trial

You might also like

Pythonデータサイエンスハンドブック 第2版 ―Jupyter、NumPy、pandas、Matplotlib、scikit-learnを使ったデータ分析、機械学習

Pythonデータサイエンスハンドブック 第2版 ―Jupyter、NumPy、pandas、Matplotlib、scikit-learnを使ったデータ分析、機械学習

Jake VanderPlas, 菊池 彰
初めてのGraphQL ―Webサービスを作って学ぶ新世代API

初めてのGraphQL ―Webサービスを作って学ぶ新世代API

Eve Porcello, Alex Banks, 尾崎 沙耶, あんどうやすし

Publisher Resources

ISBN: 9784873118413Other