Skip to Content
Pythonデータサイエンスハンドブック ―Jupyter、NumPy、pandas、Matplotlib、scikit-learnを使ったデータ分析、機械学習
book

Pythonデータサイエンスハンドブック ―Jupyter、NumPy、pandas、Matplotlib、scikit-learnを使ったデータ分析、機械学習

by Jake VanderPlas, 菊池 彰
May 2018
Intermediate to advanced
556 pages
13h 21m
Japanese
O'Reilly Japan, Inc.
Content preview from Pythonデータサイエンスハンドブック ―Jupyter、NumPy、pandas、Matplotlib、scikit-learnを使ったデータ分析、機械学習
4.3
 単純な線グラフ
229
4.3.1
 プロットの制御:線の色とスタイル
線の色とスタイルは、まず最初に調整したくなる項目です。
plt.plot()
関数には、これらを指
定するための引数があります。色の変更は、
color
キーワードに色を表す文字列引数を指定します。
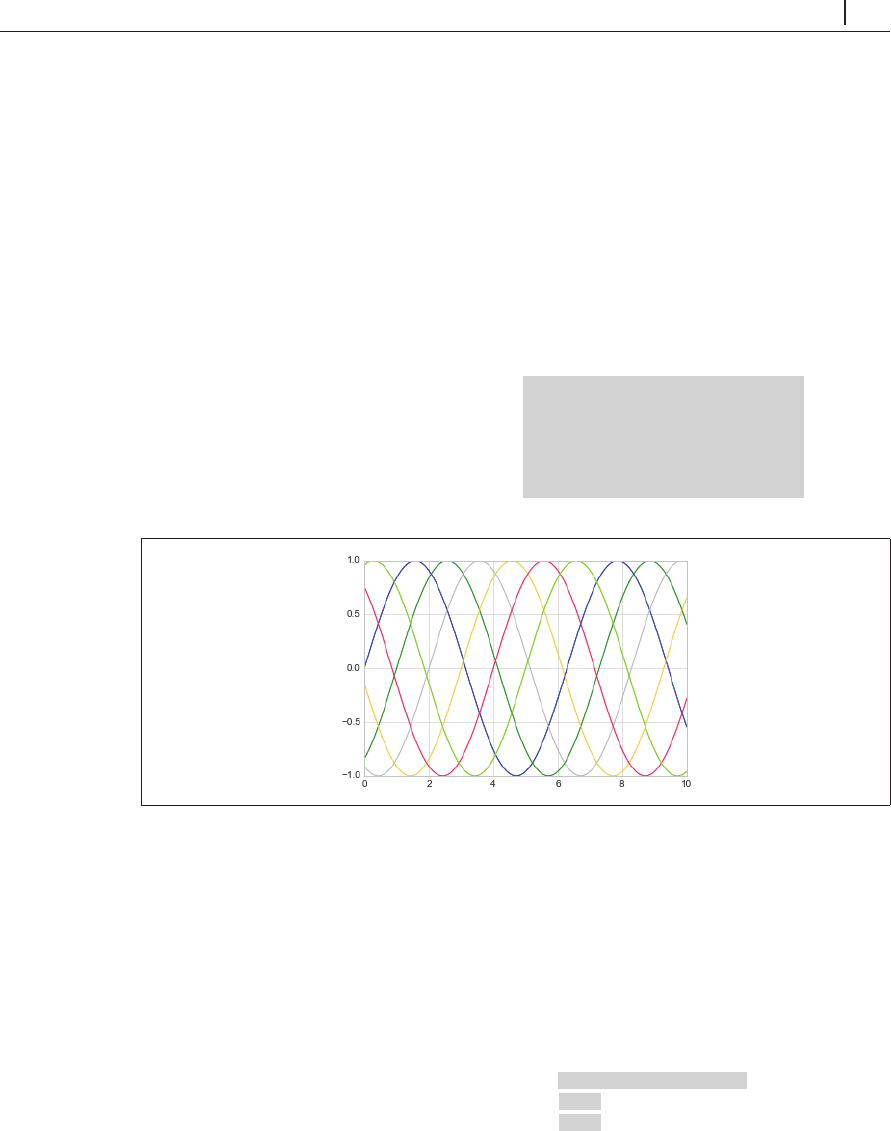
色の指定方法にはさまざまな方法があります( 4-9)。
In[6]:
plt.plot(x, np.sin(x - 0), color='blue') # specify color by name
plt.plot(x, np.sin(x - 1), color='g') # short color code (rgbcmyk)
plt.plot(x, np.sin(x - 2), color='0.75') # Grayscale between 0 and 1
plt.plot(x, np.sin(x - 3), co
lor='#FFDD44') # Hex code (RRGGBB from 00 to FF)
plt.plot(x, np.sin(x - 4), color=(1.0,0.2,0.3)) # RGB tuple, values 0 and 1
plt.plot(x, np.sin(x - 5), color='chartreuse'); # all HTML color names supported
色の名前で指定
カラーコード(
rgbcmyk
)による指定
0
から
1
の間のグレースケールを指定
16
Become an O’Reilly member and get unlimited access to this title plus top books and audiobooks from O’Reilly and nearly 200 top publishers, thousands of courses curated by job role, 150+ live events each month,
and much more.
Start your free trial

You might also like

Pythonデータサイエンスハンドブック 第2版 ―Jupyter、NumPy、pandas、Matplotlib、scikit-learnを使ったデータ分析、機械学習

Pythonデータサイエンスハンドブック 第2版 ―Jupyter、NumPy、pandas、Matplotlib、scikit-learnを使ったデータ分析、機械学習

Jake VanderPlas, 菊池 彰
初めてのGraphQL ―Webサービスを作って学ぶ新世代API

初めてのGraphQL ―Webサービスを作って学ぶ新世代API

Eve Porcello, Alex Banks, 尾崎 沙耶, あんどうやすし

Publisher Resources

ISBN: 9784873118413Other