Skip to Content
Pythonデータサイエンスハンドブック ―Jupyter、NumPy、pandas、Matplotlib、scikit-learnを使ったデータ分析、機械学習
book

Pythonデータサイエンスハンドブック ―Jupyter、NumPy、pandas、Matplotlib、scikit-learnを使ったデータ分析、機械学習

by Jake VanderPlas, 菊池 彰
May 2018
Intermediate to advanced
556 pages
13h 21m
Japanese
O'Reilly Japan, Inc.
Content preview from Pythonデータサイエンスハンドブック ―Jupyter、NumPy、pandas、Matplotlib、scikit-learnを使ったデータ分析、機械学習
4.12
 目盛のカスタマイズ
283
このようにして表示は明快になります。規則的に区切られた目盛の位置をさらに細かく制御した
い場合は、
plt.MultipleLocator
を使用することもできます(次の節で説明します)。
4.12.4
 目盛フォーマットの調整
Matplotlib
のデフォルトの目盛フォーマットは、そのままで多くの設定が行われ、デフォルトの
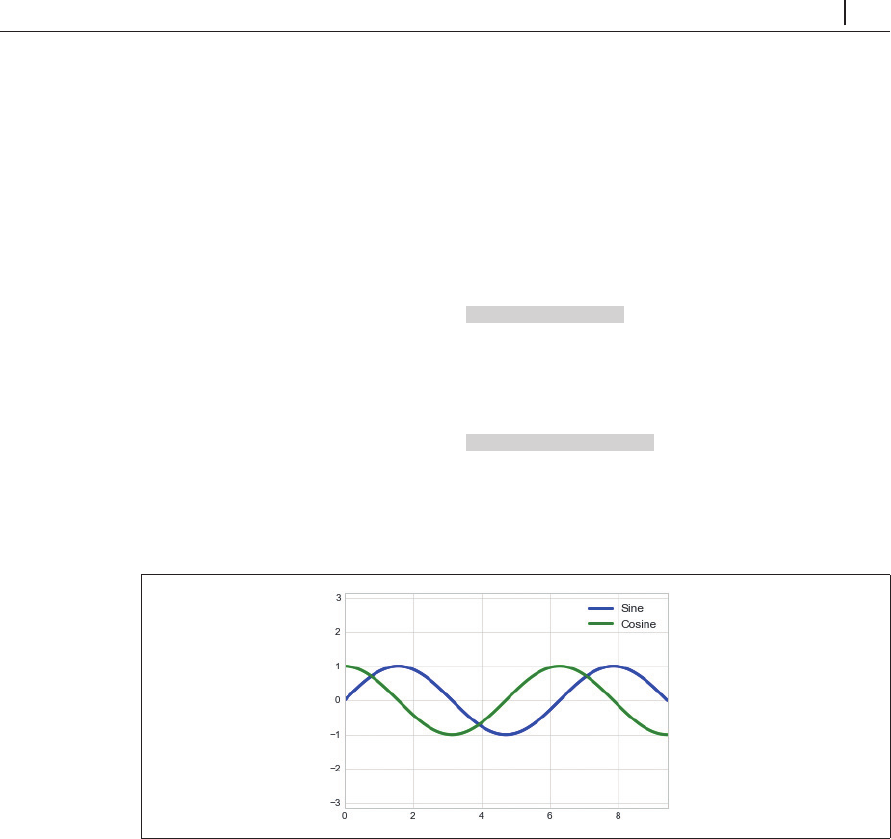
ままでもうまく機能しますが、何か変更したい状況も生じる可能性があります。 4-78 の正弦と
余弦のグラフで考えてみましょう。
In[9]: # Plot a sine and cosine curve
正弦と余弦をプロットする
fig, ax = plt.subplots()
x = np.linspace(0, 3 * np.pi, 1000)
ax.plot(x, np.sin(x), lw=3, label='Sine')
ax.plot(x, np.cos(x), lw=3, label='Cosine')
# Set up grid, legend, and limits
グリッド、凡例、範囲を設置する
ax.grid(True)
ax.legend(frameon=False)
ax.axis('equal')
ax.set_xlim(0, 3 * np.pi);
正弦
余弦
図4-78 整数目盛を使ったデフォルトプロット
変更したい点がいくつかあります。まず、このグラフでは目盛とグリッド線を πの倍数で区切
るのが自然です。 ...
Become an O’Reilly member and get unlimited access to this title plus top books and audiobooks from O’Reilly and nearly 200 top publishers, thousands of courses curated by job role, 150+ live events each month,
and much more.
Start your free trial

You might also like

Pythonデータサイエンスハンドブック 第2版 ―Jupyter、NumPy、pandas、Matplotlib、scikit-learnを使ったデータ分析、機械学習

Pythonデータサイエンスハンドブック 第2版 ―Jupyter、NumPy、pandas、Matplotlib、scikit-learnを使ったデータ分析、機械学習

Jake VanderPlas, 菊池 彰
初めてのGraphQL ―Webサービスを作って学ぶ新世代API

初めてのGraphQL ―Webサービスを作って学ぶ新世代API

Eve Porcello, Alex Banks, 尾崎 沙耶, あんどうやすし

Publisher Resources

ISBN: 9784873118413Other