Skip to Content
Pythonデータサイエンスハンドブック ―Jupyter、NumPy、pandas、Matplotlib、scikit-learnを使ったデータ分析、機械学習
book

Pythonデータサイエンスハンドブック ―Jupyter、NumPy、pandas、Matplotlib、scikit-learnを使ったデータ分析、機械学習

by Jake VanderPlas, 菊池 彰
May 2018
Intermediate to advanced
556 pages
13h 21m
Japanese
O'Reilly Japan, Inc.
Content preview from Pythonデータサイエンスハンドブック ―Jupyter、NumPy、pandas、Matplotlib、scikit-learnを使ったデータ分析、機械学習
5.8
 詳細:決定木とランダムフォレスト
431
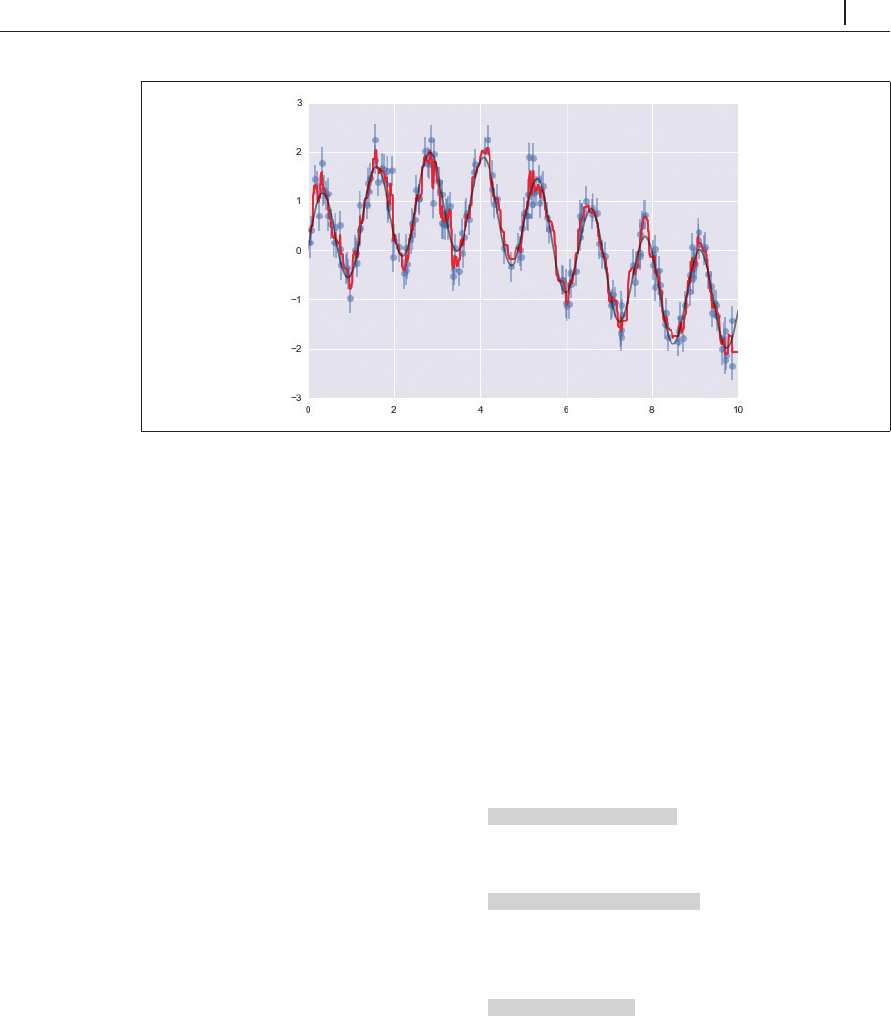
図5-77 データに当てはめたランダムフォレストモデル
5.8.4
 事例:ランダムフォレストによる文字認識
手書きの数字データについては既に取り上げました(「5.2 scikit-learnの紹介」を参照)。この問
題に対してランダムフォレスト分類器がどのように使用できるのかを見てみましょう。
In[12]: from sklearn.datasets import load_digits
digits = load_digits()
digits.keys()
Out[12]: dict_keys(['target', 'data', 'target_names', 'DESCR', 'images'])
最初のいくつかのデータを可視化して、どのような問題であったのかを再度確認しましょう(
5-78)。
In[13]:
# set up the figure
手書き数字画像のセットアップ
fig = plt.figure(figsize=(6, 6)) # figure size in inches
fig.subplots_adjust(left=0, right=1, bottom=0, top=1, hspace=0.05, wspace=0.05)
# plot the digits: each image is 8x8 pixels 8x8
の画像として、各数字をプロット
for i in range(64):
ax = fig.add_subplot(8, ...
Become an O’Reilly member and get unlimited access to this title plus top books and audiobooks from O’Reilly and nearly 200 top publishers, thousands of courses curated by job role, 150+ live events each month,
and much more.
Start your free trial

You might also like

Pythonデータサイエンスハンドブック 第2版 ―Jupyter、NumPy、pandas、Matplotlib、scikit-learnを使ったデータ分析、機械学習

Pythonデータサイエンスハンドブック 第2版 ―Jupyter、NumPy、pandas、Matplotlib、scikit-learnを使ったデータ分析、機械学習

Jake VanderPlas, 菊池 彰
初めてのGraphQL ―Webサービスを作って学ぶ新世代API

初めてのGraphQL ―Webサービスを作って学ぶ新世代API

Eve Porcello, Alex Banks, 尾崎 沙耶, あんどうやすし

Publisher Resources

ISBN: 9784873118413Other