Skip to Content
Pythonデータサイエンスハンドブック ―Jupyter、NumPy、pandas、Matplotlib、scikit-learnを使ったデータ分析、機械学習
book

Pythonデータサイエンスハンドブック ―Jupyter、NumPy、pandas、Matplotlib、scikit-learnを使ったデータ分析、機械学習

by Jake VanderPlas, 菊池 彰
May 2018
Intermediate to advanced
556 pages
13h 21m
Japanese
O'Reilly Japan, Inc.
Content preview from Pythonデータサイエンスハンドブック ―Jupyter、NumPy、pandas、Matplotlib、scikit-learnを使ったデータ分析、機械学習
414
5
章 機械学習
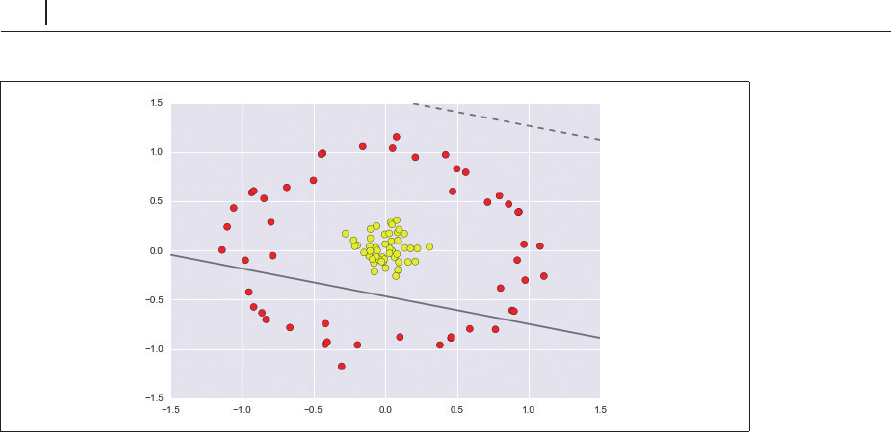
図5-59 非線形境界に対して十分に機能しない線形分類器
このデータを線形に分離できないことは明らかです。しかし、「5.6 詳細:線形回帰」基底関数
回帰で学んだように、線形分類器が扱えるようデータを高い次元に投影する方法が考えられます。
例えば、中央の集団を中心とする放射基底関数を使用するのが単純な解の
1
つです。
In[12]: r = np.exp(-(X ** 2).sum(1))
3
次元プロットを使って、追加した次元を可視化しましょう。
Jupyter notebook
を使用している
なら、スライダーを動かしてプロットを回転できます( 5-60
In[13]: from mpl_toolkits import mplot3d
def plot_3D(elev=30, azim=30, X=X, y=y):
ax = plt.subplot(projection
='3d')
ax.scatter3D(X[:, 0], X[:, 1], r, c=y, s=50, cmap='autumn')
ax.view_init(elev=elev, azim=azim)
ax.set_xlabel('x')
ax.set_ylabel('y')
ax.set_zlabel('r')
interact(plot_3D, elev=[30, 60], azip=(-180, 180),
X=fixed(X), y=fixed(y));
5.7
 詳細:サポートベクターマシン
415 ...
Become an O’Reilly member and get unlimited access to this title plus top books and audiobooks from O’Reilly and nearly 200 top publishers, thousands of courses curated by job role, 150+ live events each month,
and much more.
Start your free trial

You might also like

Pythonデータサイエンスハンドブック 第2版 ―Jupyter、NumPy、pandas、Matplotlib、scikit-learnを使ったデータ分析、機械学習

Pythonデータサイエンスハンドブック 第2版 ―Jupyter、NumPy、pandas、Matplotlib、scikit-learnを使ったデータ分析、機械学習

Jake VanderPlas, 菊池 彰
初めてのGraphQL ―Webサービスを作って学ぶ新世代API

初めてのGraphQL ―Webサービスを作って学ぶ新世代API

Eve Porcello, Alex Banks, 尾崎 沙耶, あんどうやすし

Publisher Resources

ISBN: 9784873118413Other