Skip to Content
Pythonデータサイエンスハンドブック ―Jupyter、NumPy、pandas、Matplotlib、scikit-learnを使ったデータ分析、機械学習
book

Pythonデータサイエンスハンドブック ―Jupyter、NumPy、pandas、Matplotlib、scikit-learnを使ったデータ分析、機械学習

by Jake VanderPlas, 菊池 彰
May 2018
Intermediate to advanced
556 pages
13h 21m
Japanese
O'Reilly Japan, Inc.
Content preview from Pythonデータサイエンスハンドブック ―Jupyter、NumPy、pandas、Matplotlib、scikit-learnを使ったデータ分析、機械学習
282
4
章 
Matplotlib
による可視化
各顔画像はそれぞれの軸を持ちます。この例では、目盛の値(画像なのでピクセル数)には何も
情報がないので、ロケータを
null
に設定して目盛を非表示にしています。
4.12.3
 目盛の増加と削減
小さなプロットに多数のラベルが付いてしまうのがデフォルトの設定でよく見られる問題です。
図4-76のプロットが一例です。
In[7]: fig, ax = plt.subplots(4, 4, sharex=True, sharey=True)
図4-76 デフォルトプロットの混み合った目盛
特に
x
軸では数字が重なり合うため、読み取るのが非常に困難になります。これは、表示さ
れる目盛の最大数を
plt.MaxNLocator()
を使って指定すれば改善できます。この最大数に従い、
Matplotlib
が内部ロジックで目盛の位置を適切に選択します( 4-77)。
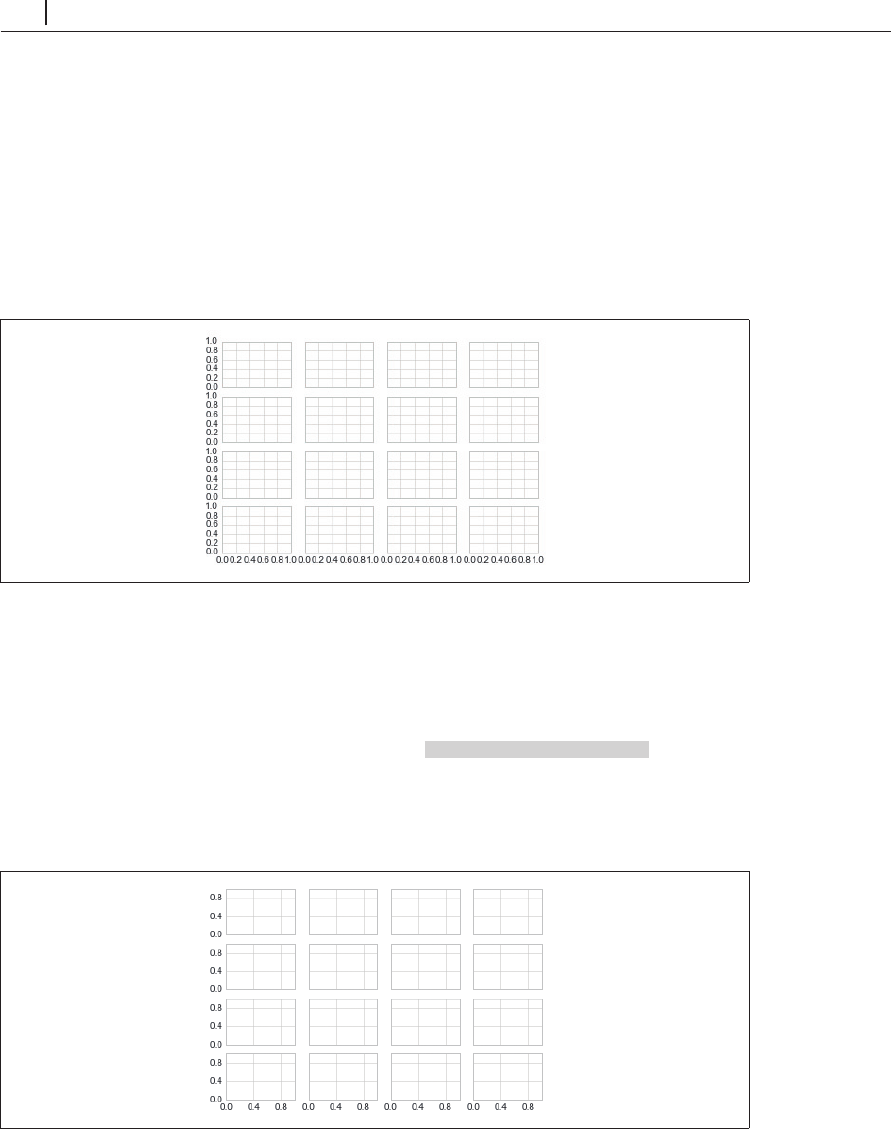
In[8]: # For every axis, set the x and y major locator x
y
軸それぞれに、主目盛を設定する
for axi in ax.flat:
axi.xaxis.set_major_locator(plt.MaxNLocator(3))
axi.yaxis.set_major_locator(plt.MaxNLocator(3))
fig
図4-77 目盛数のカスタマイズ
Become an O’Reilly member and get unlimited access to this title plus top books and audiobooks from O’Reilly and nearly 200 top publishers, thousands of courses curated by job role, 150+ live events each month,
and much more.
Start your free trial

You might also like

Pythonデータサイエンスハンドブック 第2版 ―Jupyter、NumPy、pandas、Matplotlib、scikit-learnを使ったデータ分析、機械学習

Pythonデータサイエンスハンドブック 第2版 ―Jupyter、NumPy、pandas、Matplotlib、scikit-learnを使ったデータ分析、機械学習

Jake VanderPlas, 菊池 彰
初めてのGraphQL ―Webサービスを作って学ぶ新世代API

初めてのGraphQL ―Webサービスを作って学ぶ新世代API

Eve Porcello, Alex Banks, 尾崎 沙耶, あんどうやすし

Publisher Resources

ISBN: 9784873118413Other