Skip to Content
Pythonデータサイエンスハンドブック ―Jupyter、NumPy、pandas、Matplotlib、scikit-learnを使ったデータ分析、機械学習
book

Pythonデータサイエンスハンドブック ―Jupyter、NumPy、pandas、Matplotlib、scikit-learnを使ったデータ分析、機械学習

by Jake VanderPlas, 菊池 彰
May 2018
Intermediate to advanced
556 pages
13h 21m
Japanese
O'Reilly Japan, Inc.
Content preview from Pythonデータサイエンスハンドブック ―Jupyter、NumPy、pandas、Matplotlib、scikit-learnを使ったデータ分析、機械学習
386
5
章 機械学習
づいています。以下の節でいくつかの例を見てみましょう。まず標準的なモジュールをインポート
します。
In[1]: %matplotlib inline
import numpy as np
import matplotlib.pyplot as plt
import seaborn as sns; sns.set()
5.5.2
 ガウシアンナイーブベイズ
ナイーブベイズ分類器の中でおそらく最も単純なものは、ガウシアンナイーブベイズ分類器で
しょう。この分類器では、各ラベルからのデータが単純なガウス分布に従うという仮定に基づいて
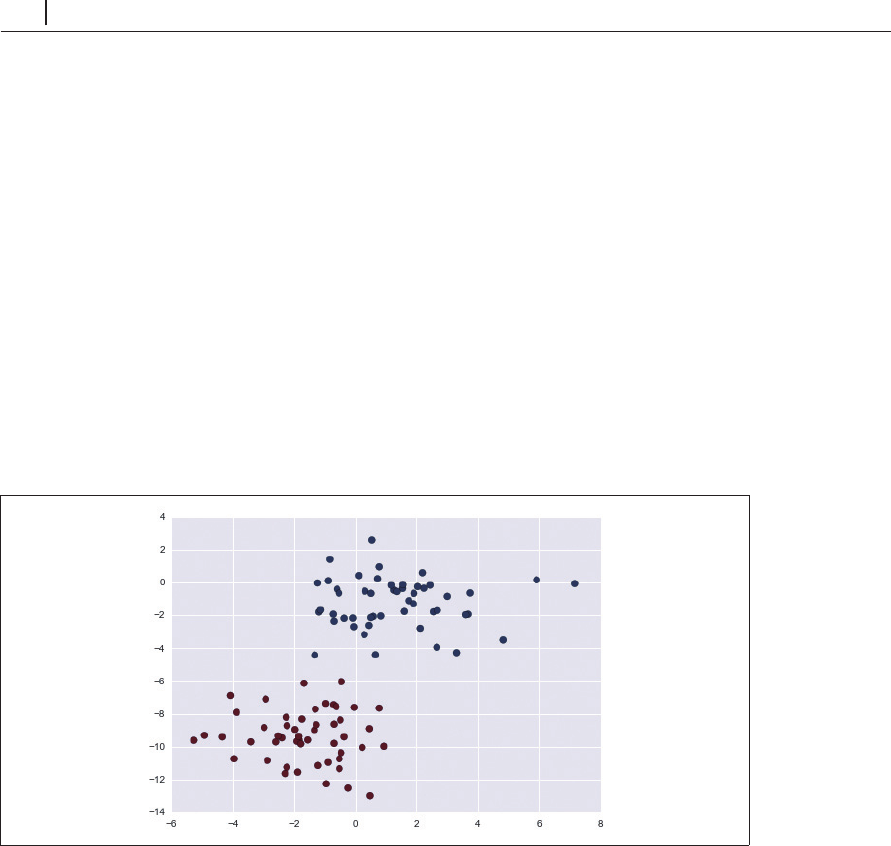
います。次のデータで考えてみましょう( 5-38)。
In[2]: from sklearn.datasets import make_blobs
X, y = make_blobs(100, 2, centers=2, rando
m_state=2, cluster_std=1.5)
plt.scatter(X[:, 0], X[:, 1], c=y, s=50, cmap='RdBu');
図5-38 ガウシアンナイーブベイズ用のデータ
データが次元間の共分散を伴わないガウス分布に基づいていると仮定することで、非常に簡単に
モデルが作成できます。モデルへの当てはめを行うには、各ラベルに対するデータポイントの平均
と標準偏差を見つけるだけで可能となります。分布を定義するのに値は、その
2
つだけだからです。
この単純なガウス推定の結果を図5-39に示します。 ...
Become an O’Reilly member and get unlimited access to this title plus top books and audiobooks from O’Reilly and nearly 200 top publishers, thousands of courses curated by job role, 150+ live events each month,
and much more.
Start your free trial

You might also like

Pythonデータサイエンスハンドブック 第2版 ―Jupyter、NumPy、pandas、Matplotlib、scikit-learnを使ったデータ分析、機械学習

Pythonデータサイエンスハンドブック 第2版 ―Jupyter、NumPy、pandas、Matplotlib、scikit-learnを使ったデータ分析、機械学習

Jake VanderPlas, 菊池 彰
初めてのGraphQL ―Webサービスを作って学ぶ新世代API

初めてのGraphQL ―Webサービスを作って学ぶ新世代API

Eve Porcello, Alex Banks, 尾崎 沙耶, あんどうやすし

Publisher Resources

ISBN: 9784873118413Other