Skip to Content
Pythonデータサイエンスハンドブック ―Jupyter、NumPy、pandas、Matplotlib、scikit-learnを使ったデータ分析、機械学習
book

Pythonデータサイエンスハンドブック ―Jupyter、NumPy、pandas、Matplotlib、scikit-learnを使ったデータ分析、機械学習

by Jake VanderPlas, 菊池 彰
May 2018
Intermediate to advanced
556 pages
13h 21m
Japanese
O'Reilly Japan, Inc.
Content preview from Pythonデータサイエンスハンドブック ―Jupyter、NumPy、pandas、Matplotlib、scikit-learnを使ったデータ分析、機械学習
478
5
章 機械学習
ポートします。
In[1]: %matplotlib inline
import matplotlib.pyplot as plt
import seaborn as sns; sns.set()
import numpy as np
5.12.1
GMM
の必要性:
k
平均法の弱点
k
平均法の弱点を見た上で、クラスタモデルをどのように改善できるかを考えてみましょう。前
の節で見たように、単純でわかりやすいデータがあれば、
k
平均法は適切なクラスタリング結果を
見つけられます。
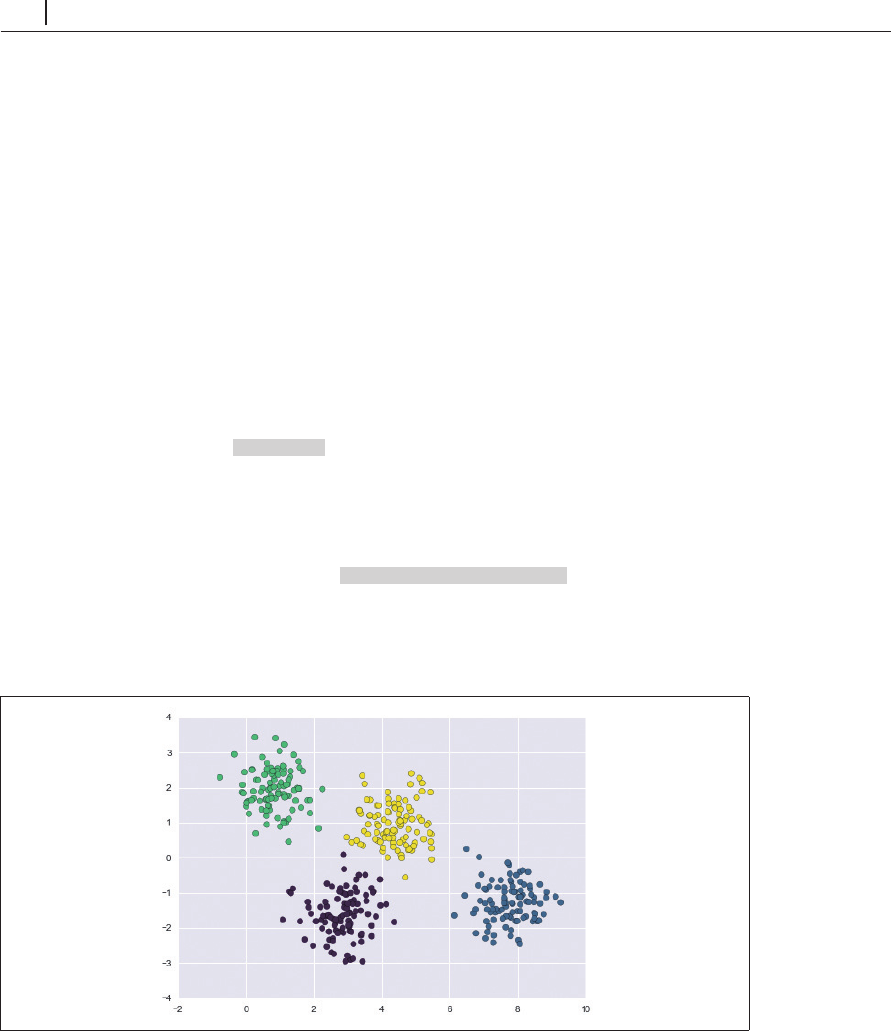
例えば、単純な集団を形成しているデータがある場合、
k
平均法アルゴリズムは見た目で行うの
と同じような方法で、クラスタに素早くラベルを付けることができます( 5-124)。
In[2]: # Generate some data
データの生成
from sklearn.datasets.
samples_generator import make_blobs
X, y_true = make_blobs(n_samples=400, centers=4,
cluster_std=0.60, random_state=0)
X = X[:, ::-1] # flip axes for better plotting
In[3]: # Plot the data with k-means labels k
平均法でラベルを推定して表示する
from sklearn.cluster import KMeans ...
Become an O’Reilly member and get unlimited access to this title plus top books and audiobooks from O’Reilly and nearly 200 top publishers, thousands of courses curated by job role, 150+ live events each month,
and much more.
Start your free trial

You might also like

Pythonデータサイエンスハンドブック 第2版 ―Jupyter、NumPy、pandas、Matplotlib、scikit-learnを使ったデータ分析、機械学習

Pythonデータサイエンスハンドブック 第2版 ―Jupyter、NumPy、pandas、Matplotlib、scikit-learnを使ったデータ分析、機械学習

Jake VanderPlas, 菊池 彰
初めてのGraphQL ―Webサービスを作って学ぶ新世代API

初めてのGraphQL ―Webサービスを作って学ぶ新世代API

Eve Porcello, Alex Banks, 尾崎 沙耶, あんどうやすし

Publisher Resources

ISBN: 9784873118413Other