Skip to Content
Pythonデータサイエンスハンドブック ―Jupyter、NumPy、pandas、Matplotlib、scikit-learnを使ったデータ分析、機械学習
book

Pythonデータサイエンスハンドブック ―Jupyter、NumPy、pandas、Matplotlib、scikit-learnを使ったデータ分析、機械学習

by Jake VanderPlas, 菊池 彰
May 2018
Intermediate to advanced
556 pages
13h 21m
Japanese
O'Reilly Japan, Inc.
Content preview from Pythonデータサイエンスハンドブック ―Jupyter、NumPy、pandas、Matplotlib、scikit-learnを使ったデータ分析、機械学習
248
4
章 
Matplotlib
による可視化
4.7
 ヒストグラム、ビニング、密度
簡単なヒストグラムは、データセットを理解するための最初の重要なステップです。既に、
Matplotlib
のヒストグラム関数は紹介済みです(「2.6 比較、マスク、ブール論理」を参照)。これは、
定型のインポートを別にして、基本的なヒストグラムを
1
行で作成できます( 4-35)。
In[1]: %matplotlib inline
import numpy as np
import matplotlib.pyplot as plt
plt.style.use('seaborn-white')
data = np.random.randn(1000)
In[2]: plt.hist(data);
図4-35 単純なヒストグラム
hist()
関数には、計算と表示の両方を調整するためのオプションが数多く用意されています。
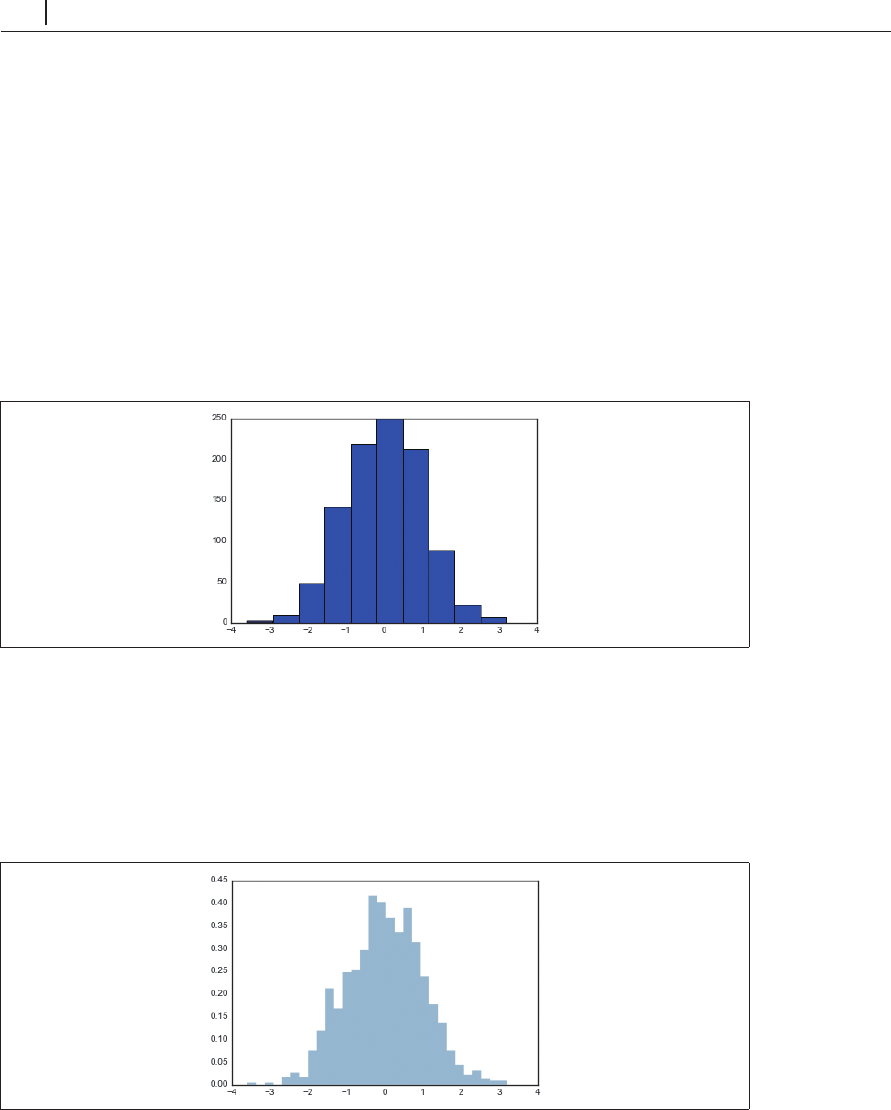
よりカスタマイズされたヒストグラムの例を次に示します( 4-36)。
In[3]: plt.hist(data, bins=30, normed=True, alpha=0.5,
histtype='stepfilled', color='steelblue',
edgecolor='none');
図4-36 カスタマイズされたヒストグラム
Become an O’Reilly member and get unlimited access to this title plus top books and audiobooks from O’Reilly and nearly 200 top publishers, thousands of courses curated by job role, 150+ live events each month,
and much more.
Start your free trial

You might also like

Pythonデータサイエンスハンドブック 第2版 ―Jupyter、NumPy、pandas、Matplotlib、scikit-learnを使ったデータ分析、機械学習

Pythonデータサイエンスハンドブック 第2版 ―Jupyter、NumPy、pandas、Matplotlib、scikit-learnを使ったデータ分析、機械学習

Jake VanderPlas, 菊池 彰
初めてのGraphQL ―Webサービスを作って学ぶ新世代API

初めてのGraphQL ―Webサービスを作って学ぶ新世代API

Eve Porcello, Alex Banks, 尾崎 沙耶, あんどうやすし

Publisher Resources

ISBN: 9784873118413Other