5.10
詳細:多様体学習
461
5.10.8
事例:手書き数字構造の可視化
可視化のための多様体学習を使用する別の例として、
MNIST
手書き数字データセットを見てみ
ましょう。このデータは、「5.8 詳細:決定木とランダムフォレスト」で使用した数字に似ていま
すが、より多くのピクセルを使用しています。このデータは
scikit-learn
のユーティリティを使用し
て
http://mldata.org/
からダウンロードできます。
In[22]: from sklearn.datasets import fetch_mldata
mnist = fetch_mldata('MNIST original')
mnist.data.shape
Out[22]: (70000, 784)
このデータには、それぞれ
784
ピクセル(すなわち、画像は
28
×
28
)の画像が
7
万個含まれます。
これまでの
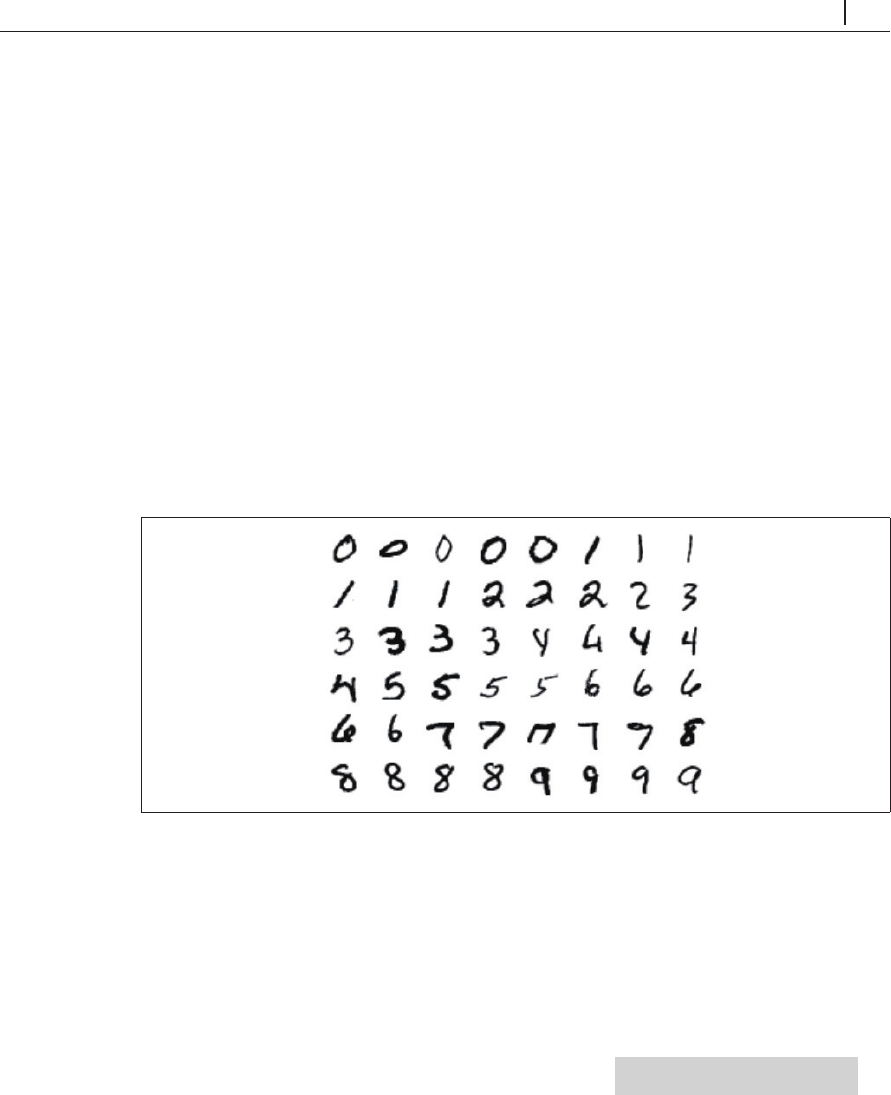
ように、最初のいくつかの画像を見てみましょう(図 5-107)。
In[23]: fig, ax = plt.subplots(6, 8, subplot_kw=dict(xticks=[], yticks=[]))
for i, axi in enumerate(ax.flat):
axi.imshow(mnist.data[1250 * i].reshape(28, 28), cmap='gray_r')
図5-107 MNIST手書き数字データ
これによりデータセットに含まれる手書き数字のさまざまなスタイルが把握できます。 ...